Looking Glass River near Eagle
Critical Stages
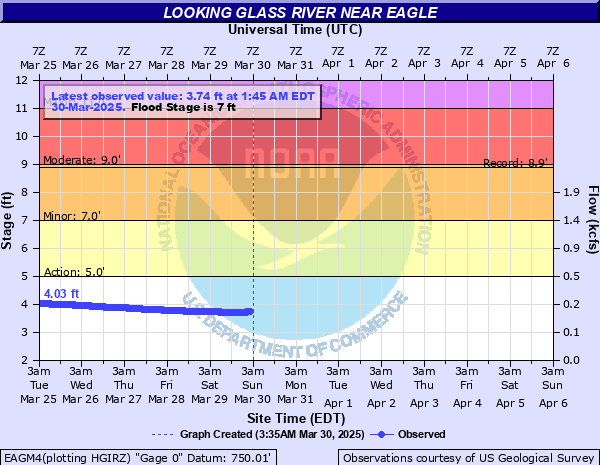
5' - Action
7' - Flood
9' - Moderate
11' - Major
Latest Observation
Updated: 11:45 AM EST 12/11/25
Status: No Flooding
Stage: 2.88 ft
Flow: 0.0788 kcfs
Forecast
Forecast not available for this location.
| Time | Stage (ft) | Flow (kcfs) |
|---|---|---|
| 11:45 AM 12/11 | 2.88 | 0.0788 |
| 11:30 AM 12/11 | 2.88 | 0.0788 |
| 11:15 AM 12/11 | 2.88 | 0.0788 |
| 11:00 AM 12/11 | 2.88 | 0.0788 |
| 10:45 AM 12/11 | 2.88 | 0.0788 |
| 10:30 AM 12/11 | 2.87 | 0.0772 |
| 10:15 AM 12/11 | 2.87 | 0.0772 |
| 10:00 AM 12/11 | 2.87 | 0.0772 |
| 9:45 AM 12/11 | 2.87 | 0.0772 |
| 9:30 AM 12/11 | 2.87 | 0.0772 |
| 9:15 AM 12/11 | 2.87 | 0.0772 |
| 9:00 AM 12/11 | 2.87 | 0.0772 |
| 8:45 AM 12/11 | 2.87 | 0.0772 |
| 8:30 AM 12/11 | 2.87 | 0.0772 |
| 8:15 AM 12/11 | 2.87 | 0.0772 |
| 8:00 AM 12/11 | 2.87 | 0.0772 |
| 7:45 AM 12/11 | 2.86 | 0.0757 |
| 7:30 AM 12/11 | 2.86 | 0.0757 |
| 7:15 AM 12/11 | 2.86 | 0.0757 |
| 7:00 AM 12/11 | 2.86 | 0.0757 |
| 6:45 AM 12/11 | 2.86 | 0.0757 |
| 6:30 AM 12/11 | 2.86 | 0.0757 |
| 6:15 AM 12/11 | 2.85 | 0.0742 |
| 6:00 AM 12/11 | 2.85 | 0.0742 |
| 5:45 AM 12/11 | 2.85 | 0.0742 |
| 5:30 AM 12/11 | 2.85 | 0.0742 |
| 5:15 AM 12/11 | 2.85 | 0.0742 |
| 5:00 AM 12/11 | 2.85 | 0.0742 |
| 4:45 AM 12/11 | 2.85 | 0.0742 |
| 4:30 AM 12/11 | 2.85 | 0.0742 |
11' -
Expect major flooding of homes in Dewitt and along the river between Dewitt and Eagle.
9' -
Expect moderate flooding of homes in Dewitt and along the Looking Glass River between Dewitt and Eagle.
8.5' -
Water reaches the bathrooms at DeWitt Park
8' -
Expect minor flooding of homes in Dewitt and along the Looking Glass River between Dewitt and Eagle. River levels flood warming hut, playground, and ball field in Looking Glass Valley Park in Wacousta.
7' -
Expect minor flooding of homes in Dewitt and along the river between Dewitt and Eagle. Flooding occurs in Riverside Park in Dewitt and Looking Glass Valley Park in Wacousta.
6.5' -
Water begins to encroach on the sidewalks at DeWitt Park and Wacousta Park
6' -
Expect minor flooding of low lying wooded areas.
5' -
River is bankfull.
| Date | Stage (ft) |
|---|---|
| Feb 21, 2018 | 8.89 |
| Jun 23, 2015 | 8.68 |
| Apr 6, 2017 | 8.39 |
| May 24, 2004 | 8.24 |
| Feb 17, 2022 | 8.17 |
| Apr 19, 2013 | 7.89 |
| Apr 5, 2023 | 7.81 |
| Jan 11, 2020 | 7.74 |
| Jun 20, 2019 | 7.58 |
| Feb 11, 2009 | 7.45 |
| Jun 14, 2015 | 7.41 |
| Jun 20, 2009 | 7.14 |
| May 30, 2011 | 7.09 |
| Jan 13, 2005 | 6.92 |
| Mar 31, 2016 | 6.66 |
| May 15, 2014 | 6.37 |
| Jan 26, 2024 | 6.35 |
| May 12, 2012 | 6.17 |
| Jun 26, 2021 | 6.07 |
| Mar 22, 2007 | 5.76 |
Data provided by the National Weather Service.