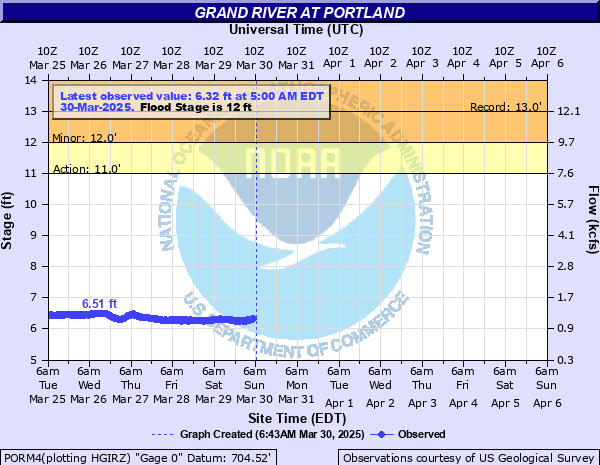
Grand River at Portland
Critical Stages
11' - Action
12' - Flood
14' - Moderate
16' - Major
Latest Observation
Updated: 12:00 PM EST 12/11/25
Status: No Flooding
Stage: 5.82 ft
Flow: 0.69 kcfs
Forecast
Forecast not available for this location.
| Time | Stage (ft) | Flow (kcfs) |
|---|---|---|
| 12:00 PM 12/11 | 5.82 | 0.69 |
| 11:45 AM 12/11 | 5.82 | 0.69 |
| 11:30 AM 12/11 | 5.81 | 0.684 |
| 11:15 AM 12/11 | 5.79 | 0.672 |
| 11:00 AM 12/11 | 5.81 | 0.684 |
| 10:45 AM 12/11 | 5.81 | 0.684 |
| 10:30 AM 12/11 | 5.8 | 0.678 |
| 10:15 AM 12/11 | 5.81 | 0.684 |
| 10:00 AM 12/11 | 5.82 | 0.69 |
| 9:45 AM 12/11 | 5.8 | 0.678 |
| 9:30 AM 12/11 | 5.79 | 0.672 |
| 9:15 AM 12/11 | 5.77 | 0.659 |
| 9:00 AM 12/11 | 5.78 | 0.665 |
| 8:45 AM 12/11 | 5.77 | 0.659 |
| 8:30 AM 12/11 | 5.78 | 0.665 |
| 8:15 AM 12/11 | 5.77 | 0.659 |
| 8:00 AM 12/11 | 5.76 | 0.653 |
| 7:45 AM 12/11 | 5.76 | 0.653 |
| 7:30 AM 12/11 | 5.75 | 0.646 |
| 7:15 AM 12/11 | 5.77 | 0.659 |
| 7:00 AM 12/11 | 5.74 | 0.64 |
| 6:45 AM 12/11 | 5.74 | 0.64 |
| 6:30 AM 12/11 | 5.75 | 0.646 |
| 6:15 AM 12/11 | 5.75 | 0.646 |
| 6:00 AM 12/11 | 5.75 | 0.646 |
| 5:45 AM 12/11 | 5.74 | 0.64 |
| 5:30 AM 12/11 | 5.75 | 0.646 |
| 5:15 AM 12/11 | 5.75 | 0.646 |
| 5:00 AM 12/11 | 5.76 | 0.653 |
| 4:45 AM 12/11 | 5.77 | 0.659 |
16' -
Expect major flooding of the business district and residential areas in the Village of Lyons and basement flooding of residences on the west side of Kent Street in Portland.
14' -
Expect moderate flooding of the first floor of residences and businesses in the south section of the Village of Lyons. Elizabeth, Superior, and Railroad Streets in the Village of Lyons closed due to flooding.
12' -
Expect minor flooding in the Village of Lyons and low lying areas adjacent to the river. Two Rivers Park in Portland flooded.
11' -
River is bankfull. Expect minor flooding of low areas along the river upstream and downstream of Portland.
| Date | Stage (ft) |
|---|---|
| Apr 21, 1975 | 12.98 |
| May 24, 2004 | 12.84 |
| Feb 23, 2018 | 12.62 |
| Feb 27, 2019 | 12.45 |
| Apr 6, 2023 | 12.21 |
| Mar 17, 1982 | 12.05 |
| Jun 30, 1968 | 11.57 |
| Mar 31, 1960 | 11.56 |
| May 13, 1956 | 11.51 |
| Sep 15, 2008 | 11.51 |
| Apr 8, 2017 | 11.41 |
| May 19, 2020 | 11.32 |
| Jan 13, 2005 | 11.19 |
| Mar 5, 1976 | 11.19 |
| Apr 20, 1993 | 11.17 |
| Feb 11, 2001 | 11.12 |
| May 30, 2011 | 11.07 |
| Jun 23, 2015 | 11.02 |
| Mar 11, 1974 | 10.93 |
| Jun 20, 2019 | 10.9 |
Data provided by the National Weather Service.