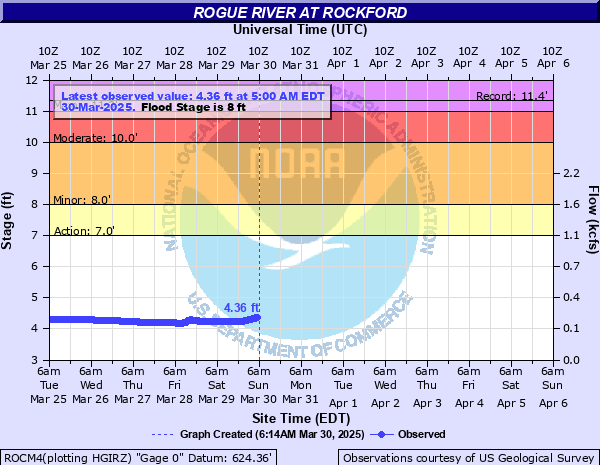
Rogue River at Rockford
Critical Stages
7' - Action
8' - Flood
10' - Moderate
11' - Major
Latest Observation
Updated: 12:00 PM EST 12/11/25
Status: No Flooding
Stage: 3.93 ft
Flow: 0.131 kcfs
Forecast
Forecast not available for this location.
| Time | Stage (ft) | Flow (kcfs) |
|---|---|---|
| 12:00 PM 12/11 | 3.93 | 0.131 |
| 11:45 AM 12/11 | 3.93 | 0.131 |
| 11:30 AM 12/11 | 3.93 | 0.131 |
| 11:15 AM 12/11 | 3.92 | 0.129 |
| 11:00 AM 12/11 | 3.92 | 0.129 |
| 10:45 AM 12/11 | 3.92 | 0.129 |
| 10:30 AM 12/11 | 3.92 | 0.129 |
| 10:15 AM 12/11 | 3.92 | 0.129 |
| 6:00 AM 12/11 | 3.92 | 0.129 |
| 5:45 AM 12/11 | 3.92 | 0.129 |
| 5:00 AM 12/11 | 3.92 | 0.129 |
| 4:45 AM 12/11 | 3.92 | 0.129 |
| 4:30 AM 12/11 | 3.92 | 0.129 |
| 4:15 AM 12/11 | 3.92 | 0.129 |
| 4:00 AM 12/11 | 3.92 | 0.129 |
| 3:45 AM 12/11 | 3.92 | 0.129 |
| 3:30 AM 12/11 | 3.92 | 0.129 |
| 3:15 AM 12/11 | 3.92 | 0.129 |
| 3:00 AM 12/11 | 3.92 | 0.129 |
| 2:45 AM 12/11 | 3.92 | 0.129 |
| 2:30 AM 12/11 | 3.92 | 0.129 |
| 2:15 AM 12/11 | 3.93 | 0.131 |
| 2:00 AM 12/11 | 3.93 | 0.131 |
| 1:45 AM 12/11 | 3.93 | 0.131 |
| 1:30 AM 12/11 | 3.93 | 0.131 |
| 1:15 AM 12/11 | 3.93 | 0.131 |
| 1:00 AM 12/11 | 3.93 | 0.131 |
| 12:45 AM 12/11 | 3.93 | 0.131 |
| 12:30 AM 12/11 | 3.93 | 0.131 |
| 12:15 AM 12/11 | 3.93 | 0.131 |
11.5' -
Water reaches the bottom of the Rogue River Road bridge.
11.35' -
Expect major flooding of residences in low lying areas adjacent to the river and along Packer Drive and Rogue River Drive.
10' -
Water reaches the bottom of the Packer Drive bridge.
9.5' -
Flooding reaches the foundation of a few homes near the Rogue River Road bridge
9.27' -
Expect minor to moderate flooding of several residences adjacent to the river.
9' -
Water begins to flood portions of Packer Drive upstream of the river gage.
8.5' -
Flooding begins on portions of the trails at the Rockford Dog Park.
8' -
Expect minor flooding of homes upstream of Rockford.
7' -
River is bankfull.
| Date | Stage (ft) |
|---|---|
| Sep 12, 1986 | 11.35 |
| Apr 19, 2013 | 9.39 |
| Mar 6, 1976 | 9.29 |
| Feb 22, 2018 | 8.99 |
| Dec 29, 2008 | 8.84 |
| Mar 15, 2019 | 8.84 |
| Mar 14, 2006 | 8.76 |
| May 19, 2020 | 8.73 |
| Oct 2, 1981 | 8.62 |
| May 19, 2000 | 8.62 |
| Jun 1, 1989 | 8.61 |
| May 17, 1974 | 8.6 |
| Mar 31, 1960 | 8.59 |
| Oct 4, 2019 | 8.49 |
| May 31, 2010 | 8.43 |
| Apr 1, 2016 | 8.43 |
| Jun 19, 1996 | 8.41 |
| Sep 1, 1975 | 8.4 |
| Feb 21, 1994 | 8.34 |
| Apr 11, 2015 | 8.34 |
Data provided by the National Weather Service.