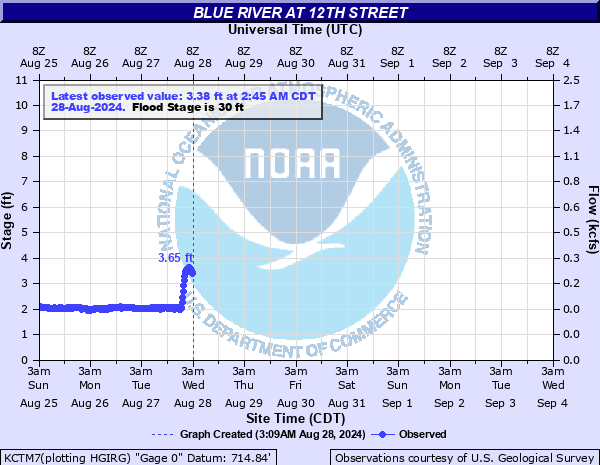
Blue River at 12th Street
Critical Stages
23' - Action
30' - Flood
35' - Moderate
40' - Major
Latest Observation
Updated: 2:45 PM CST 12/15/25
Status: No Flooding
Stage: 2.1 ft
Flow: 0.074 kcfs
Forecast
Forecast not available for this location.
| Time | Stage (ft) | Flow (kcfs) |
|---|---|---|
| 2:45 PM 12/15 | 2.1 | 0.074 |
| 2:30 PM 12/15 | 2.09 | 0.0723 |
| 2:15 PM 12/15 | 2.07 | 0.0689 |
| 2:00 PM 12/15 | 2.1 | 0.074 |
| 1:45 PM 12/15 | 2.08 | 0.0705 |
| 1:30 PM 12/15 | 2.1 | 0.074 |
| 1:15 PM 12/15 | 2.09 | 0.0723 |
| 1:00 PM 12/15 | 2.09 | 0.0723 |
| 12:45 PM 12/15 | 2.09 | 0.0723 |
| 12:30 PM 12/15 | 2.08 | 0.0705 |
| 12:15 PM 12/15 | 2.11 | 0.075 |
| 12:00 PM 12/15 | 2.11 | 0.075 |
| 11:45 AM 12/15 | 2.09 | 0.0723 |
| 11:30 AM 12/15 | 2.06 | 0.0672 |
| 11:15 AM 12/15 | 2.07 | 0.0689 |
| 11:00 AM 12/15 | 2.1 | 0.074 |
| 10:45 AM 12/15 | 2.09 | 0.0723 |
| 10:30 AM 12/15 | 2.05 | 0.0656 |
| 10:15 AM 12/15 | 2.07 | 0.0689 |
| 10:00 AM 12/15 | 2.08 | 0.0705 |
| 9:45 AM 12/15 | 2.11 | 0.075 |
| 9:30 AM 12/15 | 2.1 | 0.074 |
| 9:15 AM 12/15 | 2.09 | 0.0723 |
| 9:00 AM 12/15 | 2.09 | 0.0723 |
| 8:45 AM 12/15 | 2.07 | 0.0689 |
| 8:30 AM 12/15 | 2.09 | 0.0723 |
| 8:15 AM 12/15 | 2.08 | 0.0705 |
| 8:00 AM 12/15 | 2.09 | 0.0723 |
| 7:45 AM 12/15 | 2.09 | 0.0723 |
| 7:30 AM 12/15 | 2.07 | 0.0689 |
51' -
Flood waters overtop the 12th Street bridge.
39' -
Water reaches the bottom of the 12th Street bridge.
38' -
Extensive flooding of industrial areas along the river.
36.1' -
12th Street begins to flood about 300 yards west of the bridge.
36' -
Railroad tracks around 1,000 ft northwest of the gage begin to flood.
35' -
Water begins to affect several commercial buildings along the river.
31' -
Low-lying areas of Manchester Trafficway begin to flood just south of Truman Road.
30' -
Low-lying areas near 12th Street begin to flood. When the Missouri River is high, the flood waters from the Blue river may approach the top of the flood wall on the west bank of the Blue River near the Wilson Avenue bridge.
| Date | Stage (ft) |
|---|---|
| Sep 13, 1961 | 38 |
| May 16, 1990 | 37.42 |
| Sep 13, 1977 | 36.330001831055 |
| Jun 10, 1984 | 35.069999694824 |
| Jun 9, 1984 | 35 |
| Nov 17, 1928 | 34.2 |
| Jul 31, 1958 | 32.2 |
| Aug 22, 2017 | 31.32 |
| Aug 13, 1982 | 31.1 |
| May 18, 1995 | 29.030000686646 |
| Jul 28, 1993 | 28.780000686646 |
Data provided by the National Weather Service.