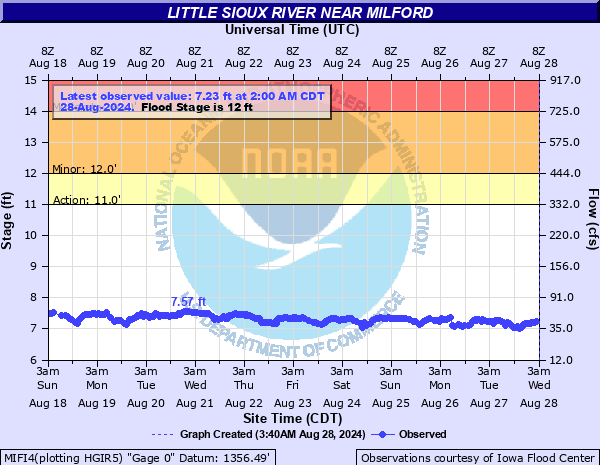
Little Sioux River near Milford
Critical Stages
11' - Action
13' - Flood
16' - Moderate
20' - Major
Latest Observation
Updated: 1:00 PM CST 12/16/25
Status: No Flooding
Stage: 6.99 ft
Flow: 0.0149 kcfs
Forecast
Forecast not available for this location.
| Time | Stage (ft) | Flow (kcfs) |
|---|---|---|
| 1:00 PM 12/16 | 6.99 | 0.0149 |
| 11:00 AM 12/16 | 7.13 | 0.0163 |
| 10:00 AM 12/16 | 7.29 | 0.0223 |
| 9:00 AM 12/16 | 7.25 | 0.0198 |
| 8:00 AM 12/16 | 7.4 | 0.03 |
| 7:00 AM 12/16 | 7.33 | 0.0249 |
| 6:00 AM 12/16 | 7.25 | 0.0198 |
| 5:00 AM 12/16 | 7.27 | 0.021 |
| 4:00 AM 12/16 | 7.27 | 0.021 |
| 3:00 AM 12/16 | 7.31 | 0.0236 |
| 2:00 AM 12/16 | 7.29 | 0.0223 |
| 1:00 AM 12/16 | 7.23 | 0.0186 |
| 12:00 AM 12/16 | 7.19 | 0.0169 |
| 11:00 PM 12/15 | 7.2 | 0.017 |
| 9:00 PM 12/15 | 7.17 | 0.0167 |
| 8:00 PM 12/15 | 7.22 | 0.0181 |
| 7:00 PM 12/15 | 7.17 | 0.0167 |
| 6:00 PM 12/15 | 7.15 | 0.0165 |
| 5:00 PM 12/15 | 7 | 0.015 |
| 4:00 PM 12/15 | 6.68 | 0.0118 |
| 3:00 PM 12/15 | 6.72 | 0.0122 |
| 2:00 PM 12/15 | 6.71 | 0.0121 |
| 1:00 PM 12/15 | 6.63 | 0.0113 |
| 12:00 PM 12/15 | 6.65 | 0.0115 |
| 11:00 AM 12/15 | 6.72 | 0.0122 |
| 10:00 AM 12/15 | 6.96 | 0.0146 |
| 9:00 AM 12/15 | 7.14 | 0.0164 |
| 8:00 AM 12/15 | 7.28 | 0.0217 |
| 7:00 AM 12/15 | 7.29 | 0.0223 |
| 6:00 AM 12/15 | 7.25 | 0.0198 |
22.5' -
The bridge on 190th is overtopped and water reaches the bottom the bridge on 170th Ave.
20.5' -
Water reaches the bottom of the bridge on 190th St.
17.5' -
The floodplain can be as wide as 0.25 mile wide in places.
16.5' -
The lowest portion of 180th St is flooded and water approaches the lowest portion of 190th Ave between 260th and 270th Streets in far southern Dickinson county.
13' -
Flooding of agricultural and pasture land begins.
12' -
The lowest banks overflow with some flooding of low lying areas begins.
| Date | Stage (ft) |
|---|---|
| Jun 22, 2024 | 20.4 |
| Jun 25, 2018 | 20.1 |
| Mar 18, 2019 | 18.02 |
| Jul 15, 2011 | 17.5 |
| Jun 19, 2014 | 17.37 |
| Aug 23, 2007 | 16.84 |
| Mar 17, 2010 | 16.65 |
| Apr 9, 2006 | 15.91 |
| Jun 14, 2001 | 15.25 |
| Mar 9, 2020 | 15.19 |
| Mar 24, 1997 | 14.28 |
| May 3, 2016 | 14 |
| Mar 1, 1982 | 13.95 |
| May 31, 2012 | 13.7 |
| Apr 5, 2023 | 13.59 |
| Mar 31, 1996 | 12.8 |
| May 24, 2017 | 12.5 |
Data provided by the National Weather Service.