« Back to Correctionville Rivers
Big Sioux River at Sioux City
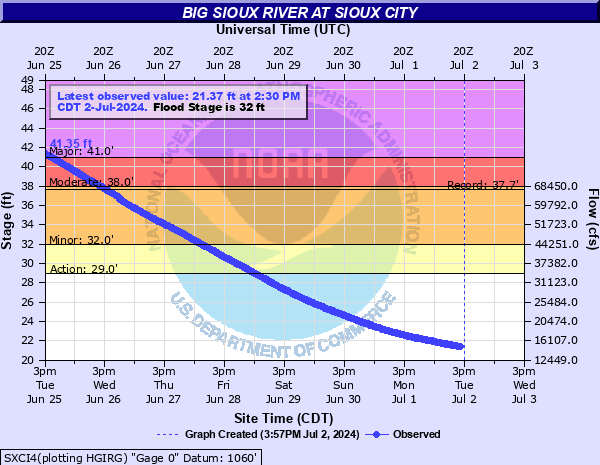
Critical Stages
29' - Action
32' - Flood
38' - Moderate
41' - Major
Latest Observation
Updated: 8:30 PM CST 12/15/25
Status: No Flooding
Stage: 7.82 ft
Flow: 0.242 kcfs
Forecast
Forecast not available for this location.
| Time | Stage (ft) | Flow (kcfs) |
|---|---|---|
| 8:30 PM 12/15 | 7.82 | 0.242 |
| 8:15 PM 12/15 | 7.79 | 0.236 |
| 8:00 PM 12/15 | 7.82 | 0.242 |
| 7:45 PM 12/15 | 7.84 | 0.247 |
| 7:30 PM 12/15 | 7.79 | 0.236 |
| 7:15 PM 12/15 | 7.78 | 0.234 |
| 7:00 PM 12/15 | 7.82 | 0.242 |
| 6:45 PM 12/15 | 7.8 | 0.238 |
| 6:30 PM 12/15 | 7.82 | 0.242 |
| 6:15 PM 12/15 | 7.78 | 0.234 |
| 6:00 PM 12/15 | 7.81 | 0.24 |
| 5:45 PM 12/15 | 7.77 | 0.232 |
| 5:30 PM 12/15 | 7.77 | 0.232 |
| 5:17 PM 12/15 | 7.77 | 0.232 |
| 5:15 PM 12/15 | 7.77 | 0.232 |
| 5:02 PM 12/15 | 7.76 | 0.229 |
| 5:00 PM 12/15 | 7.76 | 0.229 |
| 4:47 PM 12/15 | 7.76 | 0.229 |
| 4:45 PM 12/15 | 7.76 | 0.229 |
| 4:30 PM 12/15 | 7.75 | 0.227 |
| 4:15 PM 12/15 | 7.75 | 0.227 |
| 4:00 PM 12/15 | 7.72 | 0.221 |
| 3:45 PM 12/15 | 7.7 | 0.217 |
| 3:30 PM 12/15 | 7.73 | 0.223 |
| 3:15 PM 12/15 | 7.74 | 0.225 |
| 3:00 PM 12/15 | 7.7 | 0.217 |
| 2:45 PM 12/15 | 7.71 | 0.219 |
| 2:30 PM 12/15 | 7.71 | 0.219 |
| 2:15 PM 12/15 | 7.74 | 0.225 |
| 2:00 PM 12/15 | 7.72 | 0.221 |
48' -
The levees on the South Dakota side are overtopped.
45.5' -
More significant levee overtopping occurs in the Iowa Riverside Community.
43' -
The lower levees in the Iowa Riverside community are in danger of being overtopped if not sandbagged.
38' -
Most of the storm drains are submerged.
37' -
Several structures south of River Dr on the SD will flood if a levee failure occurs.
35' -
Some lower portions south of River Dr on the SD may be at risk of flooding with a levee failure.
32' -
Agricultural land north of the leveed area begins to flood.
| Date | Stage (ft) |
|---|---|
| Jun 23, 2024 | 44.9 |
| Jun 20, 2014 | 37.7 |
| Mar 17, 2019 | 37.46 |
| Jun 25, 2018 | 31.57 |
| Apr 2, 2020 | 21.89 |
| May 4, 2016 | 19.04 |
| Apr 15, 2023 | 18.57 |
| May 26, 2017 | 17.73 |
| Jul 10, 2015 | 15.09 |
| Jun 2, 2022 | 14.94 |
| Sep 1, 2021 | 12.37 |
Data provided by the National Weather Service.