« Back to Costilla County Rivers
Purgatoire River at Madrid
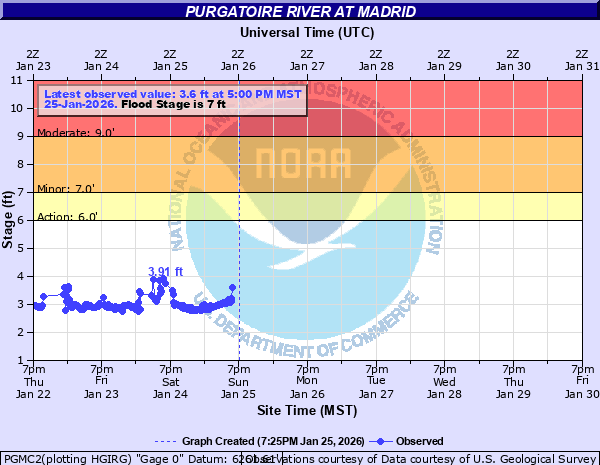
Critical Stages
6' - Action
7' - Flood
9' - Moderate
11' - Major
Latest Observation
Updated: 9:45 PM MST 12/15/25
Status: No Flooding
Stage: 2.8 ft
Flow: 0.0251 kcfs
Forecast
Forecast not available for this location.
| Time | Stage (ft) | Flow (kcfs) |
|---|---|---|
| 9:45 PM 12/15 | 2.8 | 0.0251 |
| 9:30 PM 12/15 | 2.8 | 0.0251 |
| 9:15 PM 12/15 | 2.8 | 0.0251 |
| 9:00 PM 12/15 | 2.8 | 0.0251 |
| 8:45 PM 12/15 | 2.8 | 0.0251 |
| 8:30 PM 12/15 | 2.78 | 0.023 |
| 8:15 PM 12/15 | 2.78 | 0.023 |
| 8:00 PM 12/15 | 2.78 | 0.023 |
| 7:45 PM 12/15 | 2.78 | 0.023 |
| 7:30 PM 12/15 | 2.77 | 0.022 |
| 7:15 PM 12/15 | 2.77 | 0.022 |
| 7:00 PM 12/15 | 2.78 | 0.023 |
| 6:45 PM 12/15 | 2.78 | 0.023 |
| 6:30 PM 12/15 | 2.78 | 0.023 |
| 6:15 PM 12/15 | 2.78 | 0.023 |
| 6:00 PM 12/15 | 2.75 | 0.0189 |
| 5:45 PM 12/15 | 2.72 | 0.015 |
| 5:30 PM 12/15 | 2.72 | 0.015 |
| 5:15 PM 12/15 | 2.73 | 0.0162 |
| 5:00 PM 12/15 | 2.74 | 0.0175 |
| 4:45 PM 12/15 | 2.74 | 0.0175 |
| 4:30 PM 12/15 | 2.75 | 0.0189 |
| 4:15 PM 12/15 | 2.76 | 0.0204 |
| 4:00 PM 12/15 | 2.77 | 0.022 |
| 3:45 PM 12/15 | 2.78 | 0.023 |
| 3:30 PM 12/15 | 2.79 | 0.024 |
| 3:15 PM 12/15 | 2.79 | 0.024 |
| 3:00 PM 12/15 | 2.8 | 0.0251 |
| 2:45 PM 12/15 | 2.79 | 0.024 |
| 2:30 PM 12/15 | 2.78 | 0.023 |
26.5' -
Flood waters rise into low spots along Highway 12 between Madrid and Cokedale.
17.5' -
Flood waters reach the base of the County Road 18.3 Bridge.
15' -
Flood waters rise over County Road 18.3 near the bridge.
9' -
Water begins to inundate farm properties and dwellings near Madrid.
8.5' -
Water reaches fence line in agricultural lands near County Road 18.3 Bridge.
7' -
Minor agricultural flooding occurs. Water overtops the tallest banks along the river channel.
5' -
The river is bankfull. Water spills over the lowest banks near the County Road 18.3 Bridge.
| Date | Stage (ft) |
|---|---|
| Jul 20, 1976 | 12.8 |
| Aug 10, 1981 | 10.94 |
| Jul 10, 1978 | 9 |
| Aug 14, 1979 | 8.36 |
| Jul 12, 1975 | 8 |
| Jul 31, 1992 | 7.51 |
| Jul 17, 1993 | 7.37 |
| Aug 29, 2008 | 7.17 |
| May 9, 2017 | 7.13 |
| Aug 5, 2004 | 7.12 |
| Aug 5, 1997 | 6.91 |
| Aug 13, 2015 | 6.82 |
| May 8, 2013 | 6.82 |
| Aug 26, 2014 | 6.71 |
| Sep 3, 2003 | 6.61 |
| Jul 25, 2009 | 6.47 |
Data provided by the National Weather Service.