North Loup River at Taylor
Critical Stages
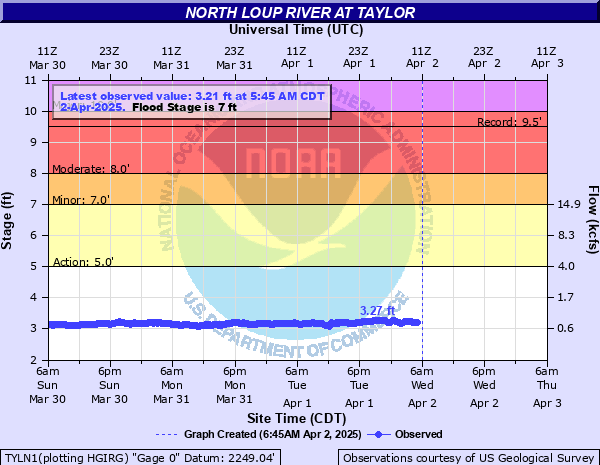
5' - Action
7' - Flood
8' - Moderate
10' - Major
Latest Observation
Updated: 5:45 AM CST 12/16/25
Status: No Flooding
Stage: 2.97 ft
Flow: 0.581 kcfs
Forecast
Forecast not available for this location.
| Time | Stage (ft) | Flow (kcfs) |
|---|---|---|
| 5:45 AM 12/16 | 2.97 | 0.581 |
| 5:30 AM 12/16 | 2.96 | 0.577 |
| 5:15 AM 12/16 | 2.96 | 0.577 |
| 5:00 AM 12/16 | 2.94 | 0.57 |
| 4:45 AM 12/16 | 2.94 | 0.57 |
| 4:30 AM 12/16 | 2.93 | 0.567 |
| 4:15 AM 12/16 | 2.93 | 0.567 |
| 4:00 AM 12/16 | 2.93 | 0.567 |
| 3:45 AM 12/16 | 2.92 | 0.564 |
| 3:30 AM 12/16 | 2.92 | 0.564 |
| 3:15 AM 12/16 | 2.92 | 0.564 |
| 3:00 AM 12/16 | 2.9 | 0.557 |
| 2:45 AM 12/16 | 2.9 | 0.557 |
| 2:30 AM 12/16 | 2.88 | 0.519 |
| 2:15 AM 12/16 | 2.88 | 0.519 |
| 2:00 AM 12/16 | 2.9 | 0.557 |
| 1:45 AM 12/16 | 2.9 | 0.557 |
| 1:30 AM 12/16 | 2.89 | 0.524 |
| 1:15 AM 12/16 | 2.92 | 0.564 |
| 1:00 AM 12/16 | 2.94 | 0.57 |
| 12:45 AM 12/16 | 2.94 | 0.57 |
| 12:30 AM 12/16 | 2.94 | 0.57 |
| 12:15 AM 12/16 | 2.94 | 0.57 |
| 12:00 AM 12/16 | 2.93 | 0.567 |
| 11:45 PM 12/15 | 2.93 | 0.567 |
| 11:30 PM 12/15 | 2.91 | 0.56 |
| 11:15 PM 12/15 | 2.91 | 0.56 |
| 11:00 PM 12/15 | 2.89 | 0.524 |
| 10:45 PM 12/15 | 2.9 | 0.557 |
| 10:30 PM 12/15 | 2.92 | 0.564 |
10' -
Major Flood Stage. Floodwaters may be flowing over 825th Road 1 mile downstream of the gagehouse as well as just north of the gage house.
9' -
Floodwaters may be flowing over 825th Road 1 mile downstream of the gage and may be approaching 825th Road just north of the gagehouse.
8' -
Moderate Flood Stage. Floodwaters may be impacting low lying areas along the river and may be flowing over 825th road 1 mile downstream from the gage.
7' -
Minor Flood Stage. Lowland flooding begins at this stage and water may be approaching 825th Road 1 mile downstream of the gage.
| Date | Stage (ft) |
|---|---|
| Feb 25, 1957 | 9.5 |
| Jun 12, 2010 | 7.27 |
| Mar 19, 1978 | 7.17 |
| Jun 18, 1955 | 6.68 |
| Feb 24, 1985 | 6.67 |
| Mar 1, 1959 | 6.56 |
| Jun 14, 1951 | 6.5 |
| Mar 10, 1989 | 6.19 |
| Jun 16, 1944 | 6.02 |
| Mar 22, 1962 | 6 |
| Oct 5, 1946 | 5.99 |
| Jun 25, 1939 | 5.98 |
| May 7, 1977 | 5.98 |
| Jun 27, 1983 | 5.94 |
| Aug 3, 1956 | 5.87 |
| Sep 2, 1942 | 5.81 |
| Jun 10, 1945 | 5.66 |
| Mar 3, 1940 | 5.65 |
| Jun 15, 1943 | 5.65 |
| May 26, 1958 | 5.64 |
Data provided by the National Weather Service.