Paint River at Crystal Falls
Critical Stages
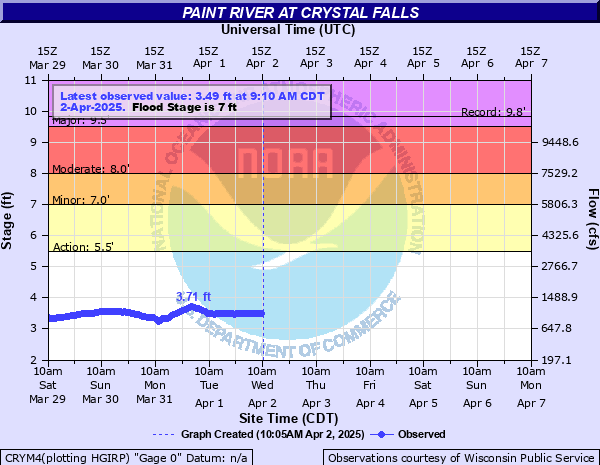
5.5' - Action
7' - Flood
8' - Moderate
9.5' - Major
Latest Observation
Updated: 2:10 PM CST 12/16/25
Status: No Flooding
Stage: 2.45 ft
Flow: 0.348 kcfs
Forecast
Forecast not available for this location.
| Time | Stage (ft) | Flow (kcfs) |
|---|---|---|
| 2:10 PM 12/16 | 2.45 | 0.348 |
| 11:10 AM 12/16 | 2.41 | 0.33 |
| 10:10 AM 12/16 | 2.43 | 0.339 |
| 8:10 AM 12/16 | 2.43 | 0.339 |
| 7:10 AM 12/16 | 2.44 | 0.343 |
| 6:10 AM 12/16 | 2.42 | 0.334 |
| 5:10 AM 12/16 | 2.45 | 0.348 |
| 4:10 AM 12/16 | 2.46 | 0.352 |
| 3:10 AM 12/16 | 2.46 | 0.352 |
| 2:10 AM 12/16 | 2.47 | 0.356 |
| 1:10 AM 12/16 | 2.47 | 0.356 |
| 12:10 AM 12/16 | 2.47 | 0.356 |
| 11:10 PM 12/15 | 2.47 | 0.356 |
| 10:10 PM 12/15 | 2.47 | 0.356 |
| 9:10 PM 12/15 | 2.46 | 0.352 |
| 8:10 PM 12/15 | 2.47 | 0.356 |
| 7:10 PM 12/15 | 2.46 | 0.352 |
| 6:10 PM 12/15 | 2.46 | 0.352 |
| 5:10 PM 12/15 | 2.45 | 0.348 |
| 4:10 PM 12/15 | 2.44 | 0.343 |
| 3:10 PM 12/15 | 2.45 | 0.348 |
| 2:10 PM 12/15 | 2.44 | 0.343 |
| 1:10 PM 12/15 | 2.41 | 0.33 |
| 12:10 PM 12/15 | 2.41 | 0.33 |
| 11:10 AM 12/15 | 2.42 | 0.334 |
| 10:10 AM 12/15 | 2.42 | 0.334 |
| 9:10 AM 12/15 | 2.41 | 0.33 |
| 8:10 AM 12/15 | 2.42 | 0.334 |
| 7:10 AM 12/15 | 2.41 | 0.33 |
| 6:10 AM 12/15 | 2.41 | 0.33 |
8' -
Parking lot of roadside park upstream of M-69 begins to flood
7' -
5600 - cfs - Waterfront park areas near the M-69 bridge and low lying areas along the river in Crystal Falls become inundated.
5.5' -
3500 - cfs - River exceeds bankfull stage
5' -
At 5 feet the lowest portions of the Robert Olson Walking Trail begin to flood
| Date | Stage (ft) |
|---|---|
| Apr 25, 1960 | 9.82 |
| Apr 17, 2002 | 9.53 |
| Jul 2, 1953 | 9.45 |
| Apr 15, 2023 | 8.73 |
| May 8, 1975 | 8.08 |
| Apr 22, 1985 | 7.95 |
| May 7, 1950 | 7.94 |
| Apr 26, 1996 | 7.89 |
| Apr 22, 2004 | 7.76 |
| May 10, 1965 | 7.69 |
| May 9, 1979 | 7.43 |
| Apr 30, 1972 | 7.39 |
| May 15, 2003 | 7.37 |
| Apr 28, 1954 | 7.35 |
| Jun 1, 1970 | 7.12 |
| Apr 20, 1952 | 7.1 |
| Apr 26, 2022 | 7.1 |
| Apr 2, 1986 | 7.07 |
| May 8, 1999 | 7.03 |
| Apr 18, 1971 | 7.01 |
Data provided by the National Weather Service.