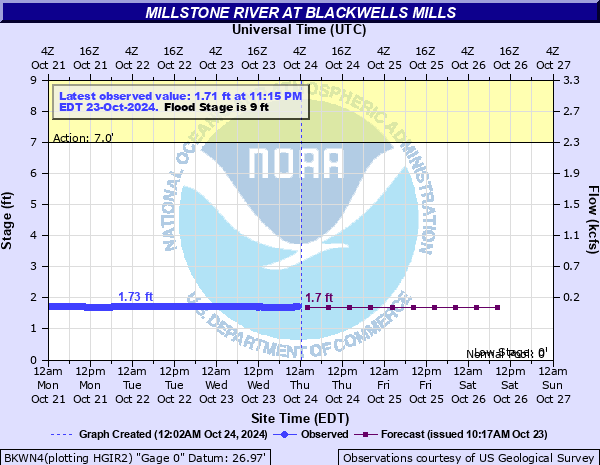
Millstone River at Blackwells Mills
Critical Stages
7' - Action
9' - Flood
10' - Moderate
15' - Major
Latest Observation
Updated: 12:15 PM EST 12/6/25
Status: No Flooding
Stage: 1.86 ft
Flow: 0.14 kcfs
Forecast
| Time | Stage (ft) | Flow (kcfs) |
|---|---|---|
| 7 PM 12/6 | 1.9 | 0.154 |
| 1 AM 12/7 | 1.9 | 0.154 |
| 7 AM 12/7 | 1.8 | 0.121 |
| 1 PM 12/7 | 1.8 | 0.121 |
| 7 PM 12/7 | 1.8 | 0.121 |
| 1 AM 12/8 | 1.8 | 0.121 |
| 7 AM 12/8 | 1.8 | 0.121 |
| 1 PM 12/8 | 1.7 | 0.093 |
| 7 PM 12/8 | 1.7 | 0.093 |
| 1 AM 12/9 | 1.7 | 0.093 |
| 7 AM 12/9 | 1.7 | 0.093 |
| Time | Stage (ft) | Flow (kcfs) |
|---|---|---|
| 12:15 PM 12/6 | 1.86 | 0.14 |
| 12:00 PM 12/6 | 1.86 | 0.14 |
| 11:45 AM 12/6 | 1.86 | 0.14 |
| 11:30 AM 12/6 | 1.86 | 0.14 |
| 11:15 AM 12/6 | 1.86 | 0.14 |
| 11:00 AM 12/6 | 1.86 | 0.14 |
| 10:45 AM 12/6 | 1.86 | 0.14 |
| 10:30 AM 12/6 | 1.86 | 0.14 |
| 10:15 AM 12/6 | 1.86 | 0.14 |
| 10:00 AM 12/6 | 1.86 | 0.14 |
| 9:45 AM 12/6 | 1.87 | 0.143 |
| 9:30 AM 12/6 | 1.87 | 0.143 |
| 9:15 AM 12/6 | 1.87 | 0.143 |
| 9:00 AM 12/6 | 1.87 | 0.143 |
| 8:45 AM 12/6 | 1.87 | 0.143 |
| 8:30 AM 12/6 | 1.9 | 0.154 |
| 8:15 AM 12/6 | 1.9 | 0.154 |
| 8:00 AM 12/6 | 1.9 | 0.154 |
| 7:45 AM 12/6 | 1.9 | 0.154 |
| 7:30 AM 12/6 | 1.9 | 0.154 |
| 7:15 AM 12/6 | 1.9 | 0.154 |
| 7:00 AM 12/6 | 1.91 | 0.157 |
| 6:45 AM 12/6 | 1.91 | 0.157 |
| 6:30 AM 12/6 | 1.91 | 0.157 |
| 6:15 AM 12/6 | 1.91 | 0.157 |
| 6:00 AM 12/6 | 1.91 | 0.157 |
| 5:45 AM 12/6 | 1.91 | 0.157 |
| 5:30 AM 12/6 | 1.91 | 0.157 |
| 5:15 AM 12/6 | 1.91 | 0.157 |
| 5:00 AM 12/6 | 1.91 | 0.157 |
13' -
Washington Street and several businesses are flooded.
10' -
The D&R Canal is flooded by the Millstone River.
9' -
Flood stage reached with flooding now along River Road in Blackwells Mills and S. River Street in Millstone. Base of Route 533 bridge floods. River Road between Yorktown and Amsterdam is subject to closure. Canal Road near Suydam Road floods.
7' -
Several more causeways are closed due to flooding.
6' -
The Griggstown Causeway is closed due to flooding.
| Date | Stage (ft) |
|---|---|
| Aug 28, 2011 | 21.24 |
| Sep 17, 1999 | 21.01 |
| Sep 2, 2021 | 20.81 |
| Apr 16, 2007 | 19.24 |
| Aug 28, 1971 | 18.68 |
| Jul 15, 1975 | 16.84 |
| Mar 14, 2010 | 16.15 |
| May 1, 2014 | 15.87 |
| Oct 20, 1996 | 15.53 |
| Sep 21, 1938 | 15.29 |
| Jan 20, 1996 | 15.09 |
| Jul 21, 1975 | 14.63 |
| Sep 21, 1989 | 14.42 |
| Aug 23, 2021 | 14.3 |
| Dec 19, 2023 | 14.22 |
| Jan 27, 1978 | 14.02 |
| Jan 29, 1994 | 13.88 |
| Sep 9, 2011 | 13.77 |
| Sep 25, 1975 | 13.47 |
| Jan 10, 2024 | 13.29 |
Data provided by the National Weather Service.