« Back to Crescent Valley Rivers
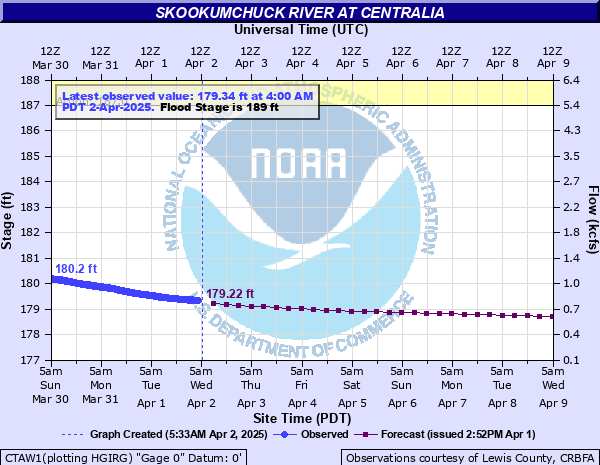
Skookumchuck River at Centralia
Critical Stages
187' - Action
189' - Flood
190' - Moderate
191' - Major
Latest Observation
Updated: 8:00 AM PST 12/6/25
Status: No Flooding
Stage: 178.27 ft
Flow: 0.479 kcfs
Forecast
| Time | Stage (ft) | Flow (kcfs) |
|---|---|---|
| 10 AM 12/6 | 178.21 | 0.459 |
| 4 PM 12/6 | 178.2 | 0.456 |
| 10 PM 12/6 | 178.15 | 0.44 |
| 4 AM 12/7 | 178.13 | 0.433 |
| 10 AM 12/7 | 178.18 | 0.449 |
| 4 PM 12/7 | 178.25 | 0.473 |
| 10 PM 12/7 | 178.31 | 0.489 |
| 4 AM 12/8 | 178.42 | 0.52 |
| 10 AM 12/8 | 178.56 | 0.563 |
| 4 PM 12/8 | 178.99 | 0.699 |
| 10 PM 12/8 | 179.79 | 0.967 |
| 4 AM 12/9 | 180.8 | 1.32 |
| 10 AM 12/9 | 181.84 | 1.71 |
| 4 PM 12/9 | 182.67 | 2.04 |
| 10 PM 12/9 | 183.21 | 2.26 |
| 4 AM 12/10 | 183.53 | 2.4 |
| 10 AM 12/10 | 183.86 | 2.59 |
| 4 PM 12/10 | 184.2 | 2.88 |
| 10 PM 12/10 | 184.98 | 3.47 |
| 4 AM 12/11 | 186.16 | 4.43 |
| 10 AM 12/11 | 187.03 | 5.38 |
| 4 PM 12/11 | 187.62 | 5.98 |
| 10 PM 12/11 | 187.79 | 6.16 |
| 4 AM 12/12 | 187.72 | 6.08 |
| 10 AM 12/12 | 187.52 | 5.88 |
| 4 PM 12/12 | 187.29 | 5.65 |
| 10 PM 12/12 | 187.08 | 5.43 |
| 4 AM 12/13 | 186.86 | 5.22 |
| 10 AM 12/13 | 186.62 | 4.95 |
| 4 PM 12/13 | 186.34 | 4.62 |
| 10 PM 12/13 | 185.96 | 4.26 |
| 4 AM 12/14 | 185.48 | 3.86 |
| 10 AM 12/14 | 185 | 3.48 |
| 4 PM 12/14 | 184.53 | 3.13 |
| 10 PM 12/14 | 184.14 | 2.83 |
| 4 AM 12/15 | 183.86 | 2.59 |
| Time | Stage (ft) | Flow (kcfs) |
|---|---|---|
| 8:00 AM 12/6 | 178.27 | 0.479 |
| 7:45 AM 12/6 | 178.27 | 0.479 |
| 7:30 AM 12/6 | 178.27 | 0.479 |
| 7:15 AM 12/6 | 178.26 | 0.476 |
| 7:00 AM 12/6 | 178.26 | 0.476 |
| 6:45 AM 12/6 | 178.26 | 0.476 |
| 6:30 AM 12/6 | 178.26 | 0.476 |
| 6:15 AM 12/6 | 178.26 | 0.476 |
| 6:00 AM 12/6 | 178.25 | 0.473 |
| 5:45 AM 12/6 | 178.26 | 0.476 |
| 5:30 AM 12/6 | 178.25 | 0.473 |
| 5:15 AM 12/6 | 178.26 | 0.476 |
| 5:00 AM 12/6 | 178.25 | 0.473 |
| 4:45 AM 12/6 | 178.26 | 0.476 |
| 4:30 AM 12/6 | 178.25 | 0.473 |
| 4:15 AM 12/6 | 178.26 | 0.476 |
| 4:00 AM 12/6 | 178.25 | 0.473 |
| 3:45 AM 12/6 | 178.25 | 0.473 |
| 3:30 AM 12/6 | 178.25 | 0.473 |
| 3:15 AM 12/6 | 178.25 | 0.473 |
| 3:00 AM 12/6 | 178.25 | 0.473 |
| 2:45 AM 12/6 | 178.25 | 0.473 |
| 2:30 AM 12/6 | 178.25 | 0.473 |
| 2:15 AM 12/6 | 178.25 | 0.473 |
| 2:00 AM 12/6 | 178.24 | 0.469 |
| 1:45 AM 12/6 | 178.25 | 0.473 |
| 1:30 AM 12/6 | 178.24 | 0.469 |
| 1:15 AM 12/6 | 178.24 | 0.469 |
| 1:00 AM 12/6 | 178.24 | 0.469 |
| 12:45 AM 12/6 | 178.23 | 0.466 |
191.5' -
the Skookumchuck River will cause severe...record flooding in Centralia and the surrounding area. The river will flood most residential areas and roads and cover most of the farmland in the Skookumchuck River valley. Flooding will occur all along the river including headwaters...tributaries...and other streams within and near the Skookumchuck River Basin. This stage corresponds to a Phase 4 flood in the Lewis County flood warning system.
191' -
the Skookumchuck River will cause major flooding in Centralia and the surrounding area. The river will flood many roads and residential areas and cover much of the farmland in the Skookumchuck River valley. Flooding will occur all along the river including headwaters...tributaries...and other streams within and near the Skookumchuck River Basin. This stage corresponds roughly to a Phase 3 flood in the Lewis County flood warning system.
190' -
the Skookumchuck River will cause moderate flooding in Centralia and the surrounding area. The river will flood many roads and residential areas and cover much of the farmland in the Skookumchuck River valley. This stage corresponds roughly to a Phase 2 flood in the Lewis County flood warning system.
189' -
the Skookumchuck River in Lewis County will flood several roads and farm lands near Centralia. This stage corresponds roughly to a Phase 2 flood in the Lewis County flood system.
187' -
the Skookumchuck River in Lewis county will spill into low areas along the river near Centralia. This river level on the Skookumchuck corresponds roughly to a Phase 1 flood in the Lewis County flood system.
| Date | Stage (ft) |
|---|---|
| Feb 8, 1996 | 191.03 |
| Jan 10, 1990 | 190.86 |
| Jan 8, 2009 | 190.34 |
| Jan 7, 2022 | 190.18 |
| Jan 6, 2015 | 187.57 |
| Apr 5, 1991 | 86.68 |
| Jan 21, 1972 | 86.6 |
| Nov 25, 1990 | 86.5 |
| Feb 11, 1990 | 86.38 |
| Dec 30, 1996 | 86.17 |
| Jan 26, 1971 | 86 |
| Dec 10, 1953 | 86 |
| Dec 12, 1955 | 85.6 |
| Nov 24, 1986 | 85.59 |
| Dec 4, 1975 | 85.46 |
| Feb 2, 1987 | 85.26 |
| Dec 16, 1999 | 85.2 |
| Dec 30, 1995 | 85.17 |
| Nov 30, 1995 | 85.17 |
| Jan 6, 1954 | 85.1 |
Data provided by the National Weather Service.