« Back to Crescent Valley Rivers
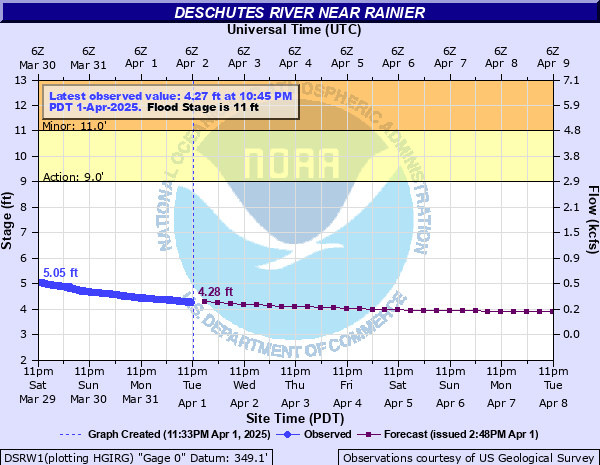
Deschutes River near Rainier
Critical Stages
9' - Action
11' - Flood
13.5' - Moderate
15' - Major
Latest Observation
Updated: 7:45 AM PST 12/6/25
Status: No Flooding
Stage: 4.21 ft
Flow: 0.27 kcfs
Forecast
| Time | Stage (ft) | Flow (kcfs) |
|---|---|---|
| 10 AM 12/6 | 4.14 | 0.249 |
| 4 PM 12/6 | 4.16 | 0.255 |
| 10 PM 12/6 | 4.2 | 0.267 |
| 4 AM 12/7 | 4.2 | 0.267 |
| 10 AM 12/7 | 4.25 | 0.283 |
| 4 PM 12/7 | 4.45 | 0.35 |
| 10 PM 12/7 | 4.63 | 0.416 |
| 4 AM 12/8 | 4.68 | 0.435 |
| 10 AM 12/8 | 4.82 | 0.491 |
| 4 PM 12/8 | 5.24 | 0.678 |
| 10 PM 12/8 | 6.36 | 1.27 |
| 4 AM 12/9 | 8.39 | 2.53 |
| 10 AM 12/9 | 8.97 | 2.97 |
| 4 PM 12/9 | 8.89 | 2.9 |
| 10 PM 12/9 | 9.03 | 3.01 |
| 4 AM 12/10 | 9.62 | 3.49 |
| 10 AM 12/10 | 9.94 | 3.76 |
| 4 PM 12/10 | 10.09 | 3.9 |
| 10 PM 12/10 | 9.86 | 3.69 |
| 4 AM 12/11 | 9.52 | 3.41 |
| 10 AM 12/11 | 9.08 | 3.05 |
| 4 PM 12/11 | 8.74 | 2.79 |
| 10 PM 12/11 | 8.26 | 2.44 |
| 4 AM 12/12 | 7.97 | 2.24 |
| 10 AM 12/12 | 7.94 | 2.22 |
| 4 PM 12/12 | 7.64 | 2.02 |
| 10 PM 12/12 | 7.41 | 1.87 |
| 4 AM 12/13 | 7.22 | 1.75 |
| 10 AM 12/13 | 7.03 | 1.64 |
| 4 PM 12/13 | 6.81 | 1.51 |
| 10 PM 12/13 | 6.59 | 1.39 |
| 4 AM 12/14 | 6.35 | 1.26 |
| 10 AM 12/14 | 6.13 | 1.15 |
| 4 PM 12/14 | 5.93 | 1.04 |
| 10 PM 12/14 | 5.78 | 0.957 |
| 4 AM 12/15 | 5.69 | 0.907 |
| Time | Stage (ft) | Flow (kcfs) |
|---|---|---|
| 7:45 AM 12/6 | 4.21 | 0.27 |
| 7:30 AM 12/6 | 4.2 | 0.267 |
| 7:15 AM 12/6 | 4.2 | 0.267 |
| 7:00 AM 12/6 | 4.19 | 0.264 |
| 6:45 AM 12/6 | 4.19 | 0.264 |
| 6:30 AM 12/6 | 4.19 | 0.264 |
| 6:15 AM 12/6 | 4.19 | 0.264 |
| 6:00 AM 12/6 | 4.19 | 0.264 |
| 5:45 AM 12/6 | 4.2 | 0.267 |
| 5:30 AM 12/6 | 4.19 | 0.264 |
| 5:15 AM 12/6 | 4.18 | 0.261 |
| 5:00 AM 12/6 | 4.18 | 0.261 |
| 4:45 AM 12/6 | 4.18 | 0.261 |
| 4:30 AM 12/6 | 4.19 | 0.264 |
| 4:15 AM 12/6 | 4.19 | 0.264 |
| 4:00 AM 12/6 | 4.18 | 0.261 |
| 3:45 AM 12/6 | 4.19 | 0.264 |
| 3:30 AM 12/6 | 4.19 | 0.264 |
| 3:15 AM 12/6 | 4.18 | 0.261 |
| 3:00 AM 12/6 | 4.17 | 0.258 |
| 2:45 AM 12/6 | 4.17 | 0.258 |
| 2:30 AM 12/6 | 4.18 | 0.261 |
| 2:15 AM 12/6 | 4.18 | 0.261 |
| 2:00 AM 12/6 | 4.17 | 0.258 |
| 1:45 AM 12/6 | 4.17 | 0.258 |
| 1:30 AM 12/6 | 4.17 | 0.258 |
| 1:15 AM 12/6 | 4.17 | 0.258 |
| 1:00 AM 12/6 | 4.16 | 0.255 |
| 12:45 AM 12/6 | 4.16 | 0.255 |
| 12:30 AM 12/6 | 4.15 | 0.252 |
16.5' -
the Deschutes River will cause severe, near record flooding. Residences will be flooded with Tumwater valley deeply flooded. Flooding will occur all along the river including headwaters...tributaries...and other streams within and near the Deschutes River Basin.
15' -
the Deschutes River will cause major flooding...with swift and deep water flooding roads...farm lands...and the residential areas of Cougar Mountain...Driftwood Valley...Falling Horseshoe and areas downstream in the Tumwater Valley. Flooding will occur all along the river including headwaters...tributaries...and other streams within and near the Deschutes River Basin.
13.5' -
the Deschutes River will flood residential areas...especially Cougar Mountain...Driftwood Valley...and Falling Horseshoe. Downstream flooding will occur in areas of Tumwater Valley including the golf course. Many roads and farm lands will also be flooded.
11' -
the Deschutes River will flood downstream in Tumwater Valley including the golf course. Minor flooding will also occur in several residential areas...mainly Cougar Mountain and Driftwood Valley. Many roads and farm lands will also be flooded.
9' -
the Deschutes River locally spills over its banks into low fields and forested lands, mainly along Vail Cutoff Road and Reichel Road (east of the town of Vail).
| Date | Stage (ft) |
|---|---|
| Jan 9, 1990 | 17.01 |
| Feb 8, 1996 | 15.74 |
| Jan 15, 1974 | 15.68 |
| Jan 21, 1972 | 15.28 |
| Dec 29, 1996 | 14.29 |
| Jan 8, 2009 | 14.1 |
| Apr 5, 1991 | 13.76 |
| Dec 3, 2007 | 13.75 |
| Nov 26, 1998 | 13.55 |
| Feb 9, 2017 | 13.52 |
| Dec 28, 1998 | 13.42 |
| Dec 4, 1975 | 13.22 |
| Jan 7, 2022 | 13.07 |
| Dec 12, 1955 | 13.06 |
| Mar 1, 2022 | 12.97 |
| Dec 9, 2015 | 12.75 |
| Jan 30, 2006 | 12.69 |
| Nov 24, 1990 | 12.65 |
| Jan 25, 1964 | 12.5 |
| Dec 15, 2006 | 12.41 |
Data provided by the National Weather Service.