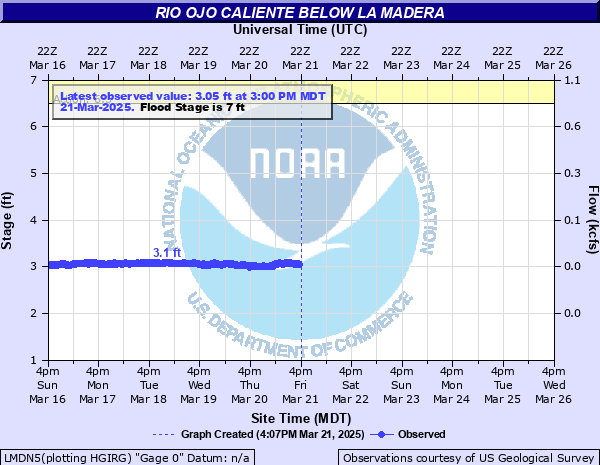
Rio Ojo Caliente below La Madera
Critical Stages
6.5' - Action
7' - Flood
9' - Moderate
10' - Major
Latest Observation
Updated: 4:00 AM MST 12/16/25
Status: No Flooding
Stage: 2.78 ft
Flow: 0.0171 kcfs
Forecast
Forecast not available for this location.
| Time | Stage (ft) | Flow (kcfs) |
|---|---|---|
| 4:00 AM 12/16 | 2.78 | 0.0171 |
| 3:45 AM 12/16 | 2.76 | 0.0163 |
| 3:30 AM 12/16 | 2.76 | 0.0163 |
| 3:15 AM 12/16 | 2.76 | 0.0163 |
| 3:00 AM 12/16 | 2.76 | 0.0163 |
| 2:45 AM 12/16 | 2.77 | 0.0167 |
| 2:30 AM 12/16 | 2.77 | 0.0167 |
| 2:15 AM 12/16 | 2.77 | 0.0167 |
| 2:00 AM 12/16 | 2.76 | 0.0163 |
| 1:45 AM 12/16 | 2.77 | 0.0167 |
| 1:30 AM 12/16 | 2.75 | 0.0159 |
| 1:15 AM 12/16 | 2.72 | 0.0147 |
| 1:00 AM 12/16 | 2.71 | 0.0144 |
| 12:45 AM 12/16 | 2.7 | 0.014 |
| 12:30 AM 12/16 | 2.69 | 0.0135 |
| 12:15 AM 12/16 | 2.69 | 0.0135 |
| 12:00 AM 12/16 | 2.69 | 0.0135 |
| 11:45 PM 12/15 | 2.69 | 0.0135 |
| 11:30 PM 12/15 | 2.69 | 0.0135 |
| 11:15 PM 12/15 | 2.7 | 0.014 |
| 11:00 PM 12/15 | 2.7 | 0.014 |
| 10:45 PM 12/15 | 2.7 | 0.014 |
| 10:30 PM 12/15 | 2.7 | 0.014 |
| 10:15 PM 12/15 | 2.7 | 0.014 |
| 10:00 PM 12/15 | 2.71 | 0.0144 |
| 9:45 PM 12/15 | 2.71 | 0.0144 |
| 9:30 PM 12/15 | 2.71 | 0.0144 |
| 9:15 PM 12/15 | 2.71 | 0.0144 |
| 9:00 PM 12/15 | 2.71 | 0.0144 |
| 8:45 PM 12/15 | 2.72 | 0.0147 |
9' -
irrgation gates and controls along the river are inundated. Some homes nearest the river are threatened or already inundated by the floodwaters. Flooding can also be expected at the confluence of the Rio Chama and further down river toward Espanola along the Rio Chama.
7' -
farm and pasture land is being inundated, and irrigation channels and gates may be severely damaged if high flows persist.
6.5' -
bankfull stage. Minor inundation due to overbank flow possible. Nuisance flooding is possible in low lying areas downstream near the confluence of the Rio Ojo Caliente and the Rio Chama.
| Date | Stage (ft) |
|---|---|
| Aug 25, 2025 | 10.32 |
| Aug 14, 1994 | 8.27 |
| Jul 8, 1998 | 7.7 |
| Jul 26, 2007 | 7.35 |
| Jun 29, 2000 | 7.15 |
| May 9, 2017 | 7.13 |
| Apr 20, 2017 | 6.85 |
| Apr 21, 1958 | 6.42 |
| May 8, 1980 | 6.33 |
| May 6, 1985 | 6.26 |
| May 18, 2005 | 6.22 |
| Apr 30, 2009 | 6.02 |
| Jul 9, 2002 | 5.86 |
| Apr 23, 1942 | -9.9 |
| May 13, 1941 | -9.9 |
| May 5, 1952 | -9.9 |
| Apr 16, 1937 | -9.9 |
Data provided by the National Weather Service.