« Back to Custer State Park Rivers
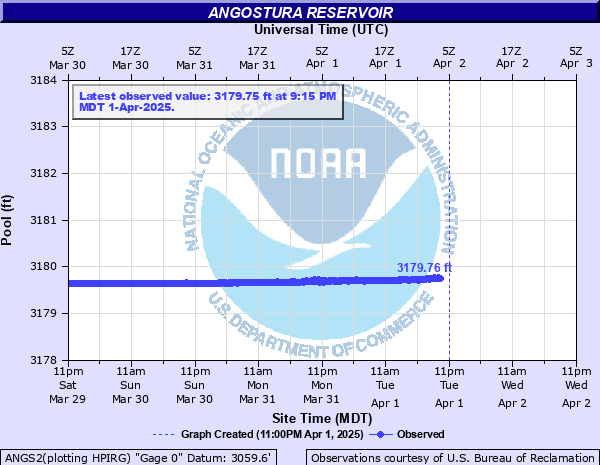
Angostura Reservoir
Critical Stages
3187.2' - Action
Flood
Moderate
Major
Latest Observation
Updated: 10:15 PM MST 12/14/25
Status: No Flooding
Stage: 3172.52 ft
Flow: -999 kcfs
Forecast
Forecast not available for this location.
| Time | Stage (ft) | Flow (kcfs) |
|---|---|---|
| 10:15 PM 12/14 | 3172.52 | -999 |
| 10:00 PM 12/14 | 3172.53 | -999 |
| 9:45 PM 12/14 | 3172.53 | -999 |
| 9:30 PM 12/14 | 3172.53 | -999 |
| 9:15 PM 12/14 | 3172.52 | -999 |
| 9:00 PM 12/14 | 3172.52 | -999 |
| 8:45 PM 12/14 | 3172.53 | -999 |
| 8:30 PM 12/14 | 3172.52 | -999 |
| 8:15 PM 12/14 | 3172.52 | -999 |
| 8:00 PM 12/14 | 3172.52 | -999 |
| 7:45 PM 12/14 | 3172.52 | -999 |
| 7:30 PM 12/14 | 3172.52 | -999 |
| 7:15 PM 12/14 | 3172.52 | -999 |
| 7:00 PM 12/14 | 3172.52 | -999 |
| 6:45 PM 12/14 | 3172.52 | -999 |
| 6:30 PM 12/14 | 3172.51 | -999 |
| 6:15 PM 12/14 | 3172.52 | -999 |
| 6:00 PM 12/14 | 3172.51 | -999 |
| 5:45 PM 12/14 | 3172.52 | -999 |
| 5:30 PM 12/14 | 3172.51 | -999 |
| 5:15 PM 12/14 | 3172.51 | -999 |
| 5:00 PM 12/14 | 3172.5 | -999 |
| 4:45 PM 12/14 | 3172.51 | -999 |
| 4:30 PM 12/14 | 3172.51 | -999 |
| 4:15 PM 12/14 | 3172.51 | -999 |
| 4:00 PM 12/14 | 3172.51 | -999 |
| 3:45 PM 12/14 | 3172.52 | -999 |
| 3:30 PM 12/14 | 3172.51 | -999 |
| 3:15 PM 12/14 | 3172.51 | -999 |
| 3:00 PM 12/14 | 3172.52 | -999 |
3199' -
Dam crest elevation.
3198.1' -
Maximum Water Surface or Top of Surcharge Capacity.
3195' -
Discharge from the reservoir is about 120,000 cfs with automatic control; higher with high inflows and manual control.
3187.2' -
Top of active conservation elevation.
3163' -
Elevation at top of inactive storage.
3062' -
Streambed elevation at dam axis.
| Date | Stage (ft) |
|---|---|
| May 20, 1978 | 3189.37 |
| Jun 18, 1962 | 3189 |
| May 25, 1971 | 3188.42 |
| Jun 17, 1967 | 3188 |
| May 27, 1957 | 3187.91 |
| Jun 19, 1965 | 3187.9 |
| Jun 11, 1986 | 3187.63 |
| Jul 20, 1969 | 3187.63 |
| Jun 2, 1991 | 3187.62 |
| Jun 11, 1968 | 3187.57 |
| May 2, 1963 | 3187.45 |
| Aug 1, 1958 | 3187.41 |
| May 20, 1955 | 3187.37 |
| Apr 23, 2000 | 3187.33 |
| Apr 16, 1974 | 3187.31 |
| Mar 17, 1966 | 3187.31 |
| Jun 21, 1964 | 3187.3 |
| May 9, 1973 | 3187.29 |
| May 25, 2010 | 3187.27 |
| Jun 30, 1972 | 3187.26 |
Data provided by the National Weather Service.