« Back to Custer State Park Rivers
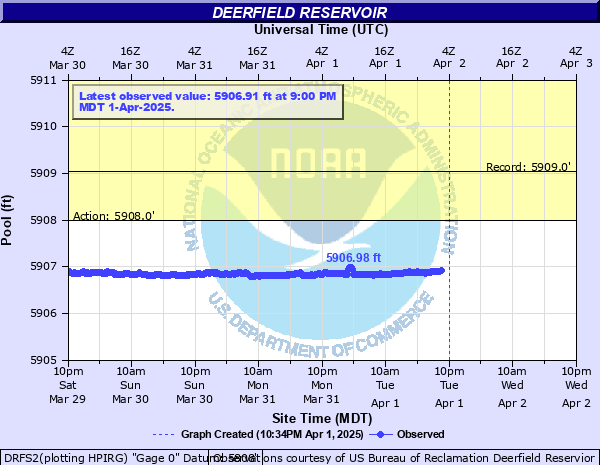
Deerfield Reservoir
Critical Stages
5908' - Action
Flood
Moderate
Major
Latest Observation
Updated: 10:00 PM MST 12/14/25
Status: No Flooding
Stage: 5907.02 ft
Flow: -999 kcfs
Forecast
Forecast not available for this location.
| Time | Stage (ft) | Flow (kcfs) |
|---|---|---|
| 10:00 PM 12/14 | 5907.02 | -999 |
| 9:45 PM 12/14 | 5907.05 | -999 |
| 9:30 PM 12/14 | 5907.02 | -999 |
| 9:15 PM 12/14 | 5907.04 | -999 |
| 9:00 PM 12/14 | 5907.03 | -999 |
| 8:45 PM 12/14 | 5907.02 | -999 |
| 8:30 PM 12/14 | 5907.04 | -999 |
| 8:15 PM 12/14 | 5907.01 | -999 |
| 8:00 PM 12/14 | 5907 | -999 |
| 7:45 PM 12/14 | 5907 | -999 |
| 7:30 PM 12/14 | 5907.01 | -999 |
| 7:15 PM 12/14 | 5907.02 | -999 |
| 7:00 PM 12/14 | 5907.04 | -999 |
| 6:45 PM 12/14 | 5907.01 | -999 |
| 6:30 PM 12/14 | 5907.02 | -999 |
| 6:15 PM 12/14 | 5907.03 | -999 |
| 6:00 PM 12/14 | 5907.04 | -999 |
| 5:45 PM 12/14 | 5907.04 | -999 |
| 5:30 PM 12/14 | 5907.05 | -999 |
| 5:15 PM 12/14 | 5907 | -999 |
| 5:00 PM 12/14 | 5907.02 | -999 |
| 4:45 PM 12/14 | 5907.03 | -999 |
| 4:30 PM 12/14 | 5907.03 | -999 |
| 4:15 PM 12/14 | 5907.03 | -999 |
| 4:00 PM 12/14 | 5907.05 | -999 |
| 3:45 PM 12/14 | 5907.03 | -999 |
| 3:30 PM 12/14 | 5907.04 | -999 |
| 3:15 PM 12/14 | 5907.03 | -999 |
| 3:00 PM 12/14 | 5907.01 | -999 |
| 2:45 PM 12/14 | 5907.01 | -999 |
5958' -
Dam crest elevation.
5953' -
Maximum water surface elevation or the top of the surcharge capacity.
5912' -
Spillway releases over an uncontrolled crest and open cut channel in the right abutment begin.
5908' -
Top of active conservation pool.
5839' -
Top of dead pool elevation.
5808' -
Streambed elevation.
| Date | Stage (ft) |
|---|---|
| Feb 25, 1985 | 5909.05 |
| Jun 2, 2011 | 5908.73 |
| Jun 21, 1998 | 5908.65 |
| Jun 14, 1996 | 5908.52 |
| Jun 12, 1995 | 5908.26 |
| May 27, 2010 | 5908.25 |
| May 31, 2019 | 5908.25 |
| Oct 29, 1996 | 5908.24 |
| Jun 21, 1999 | 5908.23 |
| Apr 28, 1970 | 5908.2 |
| Apr 20, 1971 | 5908.19 |
| May 18, 1978 | 5908.16 |
| Apr 7, 1965 | 5908.15 |
| Apr 19, 1973 | 5908.15 |
| Jun 9, 1964 | 5908.14 |
| Apr 9, 1969 | 5908.11 |
| Apr 17, 1975 | 5908.11 |
| Jun 24, 2015 | 5908.07 |
| Apr 10, 1968 | 5908.06 |
| Apr 5, 1974 | 5908.04 |
Data provided by the National Weather Service.