« Back to Custer State Park Rivers
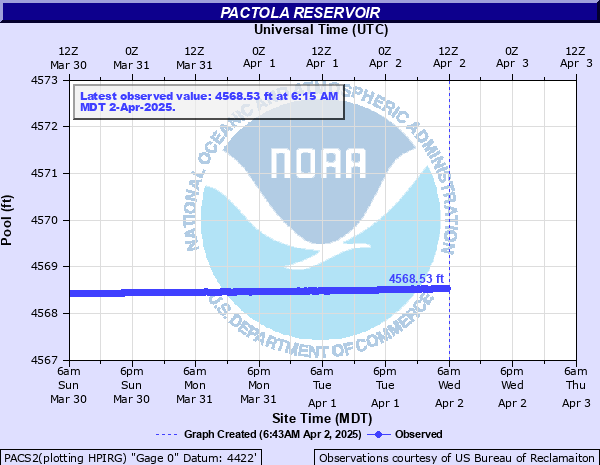
Pactola Reservoir
Critical Stages
4580.2' - Action
Flood
Moderate
Major
Latest Observation
Updated: 10:15 PM MST 12/14/25
Status: No Flooding
Stage: 4568.87 ft
Flow: -999 kcfs
Forecast
Forecast not available for this location.
| Time | Stage (ft) | Flow (kcfs) |
|---|---|---|
| 10:15 PM 12/14 | 4568.87 | -999 |
| 10:00 PM 12/14 | 4568.86 | -999 |
| 9:45 PM 12/14 | 4568.87 | -999 |
| 9:30 PM 12/14 | 4568.87 | -999 |
| 9:15 PM 12/14 | 4568.87 | -999 |
| 9:00 PM 12/14 | 4568.87 | -999 |
| 8:45 PM 12/14 | 4568.86 | -999 |
| 8:30 PM 12/14 | 4568.86 | -999 |
| 8:15 PM 12/14 | 4568.86 | -999 |
| 8:00 PM 12/14 | 4568.87 | -999 |
| 7:45 PM 12/14 | 4568.87 | -999 |
| 7:30 PM 12/14 | 4568.87 | -999 |
| 7:15 PM 12/14 | 4568.87 | -999 |
| 7:00 PM 12/14 | 4568.87 | -999 |
| 6:45 PM 12/14 | 4568.87 | -999 |
| 6:30 PM 12/14 | 4568.87 | -999 |
| 6:15 PM 12/14 | 4568.87 | -999 |
| 6:00 PM 12/14 | 4568.87 | -999 |
| 5:45 PM 12/14 | 4568.87 | -999 |
| 5:30 PM 12/14 | 4568.87 | -999 |
| 5:15 PM 12/14 | 4568.87 | -999 |
| 5:00 PM 12/14 | 4568.87 | -999 |
| 4:45 PM 12/14 | 4568.86 | -999 |
| 4:30 PM 12/14 | 4568.86 | -999 |
| 4:15 PM 12/14 | 4568.86 | -999 |
| 4:00 PM 12/14 | 4568.86 | -999 |
| 3:45 PM 12/14 | 4568.86 | -999 |
| 3:30 PM 12/14 | 4568.86 | -999 |
| 3:15 PM 12/14 | 4568.87 | -999 |
| 3:00 PM 12/14 | 4568.86 | -999 |
4655' -
Dam Crest Elevation
4651.7' -
Elevation that would produce max discharge through the spillway, 245K cfs.
4621.5' -
Reservoir capacity 99K acre ft. Top of flood control zone or when uncontrolled flow over spillway begins.
4590' -
This would be a record high pool elevation
4585' -
Flooding of timber stands adjacent to the reservoir and the marina and other developed recreation facilities on the reservoir.
4580.2' -
Normal Pool Elevation - Top of Active Conservation
4456.1' -
Top of Inactive Conservation
4440' -
Top of Dead Pool
| Date | Stage (ft) |
|---|---|
| Jun 29, 2015 | 4589.46 |
| Jun 5, 2019 | 4588.63 |
| May 19, 1965 | 4585.87 |
| May 21, 1978 | 4585.44 |
| Jun 4, 1996 | 4585.35 |
| Jun 22, 1972 | 4585.06 |
| Jun 3, 2011 | 4584.87 |
| Jun 23, 1998 | 4584.76 |
| Jun 21, 1967 | 4584.5 |
| Jun 21, 1999 | 4584.48 |
| May 15, 1995 | 4583.3 |
| Jun 7, 1997 | 4583.19 |
| May 30, 2010 | 4582.66 |
| Jun 19, 1993 | 4581.97 |
| Jul 2, 1982 | 4581.66 |
| Nov 23, 1999 | 4581.54 |
| Jun 14, 1984 | 4581.35 |
| Jun 15, 1964 | 4581.3 |
| Jun 20, 1976 | 4581.27 |
| May 30, 2018 | 4581.08 |
Data provided by the National Weather Service.