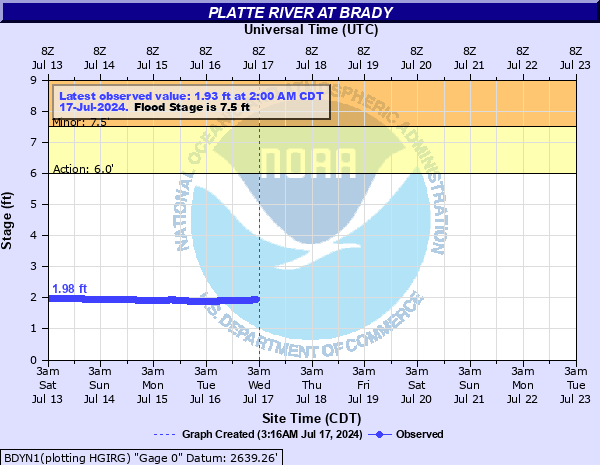
Platte River at Brady
Critical Stages
6' - Action
7.5' - Flood
9' - Moderate
11' - Major
Latest Observation
Updated: 5:00 AM CST 12/16/25
Status: No Flooding
Stage: 2.27 ft
Flow: 0.0753 kcfs
Forecast
Forecast not available for this location.
| Time | Stage (ft) | Flow (kcfs) |
|---|---|---|
| 5:00 AM 12/16 | 2.27 | 0.0753 |
| 4:45 AM 12/16 | 2.28 | 0.0781 |
| 4:30 AM 12/16 | 2.29 | 0.081 |
| 4:15 AM 12/16 | 2.3 | 0.084 |
| 4:00 AM 12/16 | 2.31 | 0.0863 |
| 3:45 AM 12/16 | 2.32 | 0.0886 |
| 3:30 AM 12/16 | 2.33 | 0.0909 |
| 3:15 AM 12/16 | 2.33 | 0.0909 |
| 3:00 AM 12/16 | 2.34 | 0.0934 |
| 2:45 AM 12/16 | 2.34 | 0.0934 |
| 2:30 AM 12/16 | 2.34 | 0.0934 |
| 2:15 AM 12/16 | 2.34 | 0.0934 |
| 2:00 AM 12/16 | 2.34 | 0.0934 |
| 1:45 AM 12/16 | 2.34 | 0.0934 |
| 1:30 AM 12/16 | 2.34 | 0.0934 |
| 1:15 AM 12/16 | 2.33 | 0.0909 |
| 1:00 AM 12/16 | 2.32 | 0.0886 |
| 12:45 AM 12/16 | 2.31 | 0.0863 |
| 12:30 AM 12/16 | 2.29 | 0.081 |
| 12:15 AM 12/16 | 2.28 | 0.0781 |
| 12:00 AM 12/16 | 2.28 | 0.0781 |
| 11:45 PM 12/15 | 2.27 | 0.0753 |
| 11:30 PM 12/15 | 2.25 | 0.0699 |
| 11:15 PM 12/15 | 2.25 | 0.0699 |
| 11:00 PM 12/15 | 2.23 | 0.0649 |
| 10:45 PM 12/15 | 2.23 | 0.0649 |
| 10:30 PM 12/15 | 2.23 | 0.0649 |
| 10:15 PM 12/15 | 2.22 | 0.0625 |
| 10:00 PM 12/15 | 2.22 | 0.0625 |
| 9:45 PM 12/15 | 2.22 | 0.0625 |
12' -
Widespread flooding along the Platte River and in Brady south of Highway 30 and the railroad tracks. Water may approach the Dairy Queen and gas station parking lot just north of Interstate 80. Homes and properties on both sides of the north channel may flood.
11' -
Major flood stage. Widespread flooding along the Platte River including areas along McCollough Road and East Island Road.
10' -
Water reaches McCullough road along the north side of the Platte River. Water may begin to surround homes and could restrict access to homes and properties.
9' -
Moderate flood stage. West of Brady flooding occurs between McCullough Road and East Island Road and Interstate 80. East of Brady flooding of agricultural land occurs near Interstate 80. Both of the north channels may overflow.
7.5' -
Flood Stage. Minor flooding along and near the Platte River.
7' -
The river is near bankfull with ponding of water in low lying areas along the river.
| Date | Stage (ft) |
|---|---|
| Sep 23, 2013 | 9.8 |
| May 14, 1973 | 9.6 |
| Jun 29, 1983 | 9.2 |
| May 9, 1999 | 9.12 |
| May 23, 1980 | 8.8 |
| Jun 21, 1997 | 8.4 |
Data provided by the National Weather Service.