« Back to Darlington Heights Rivers
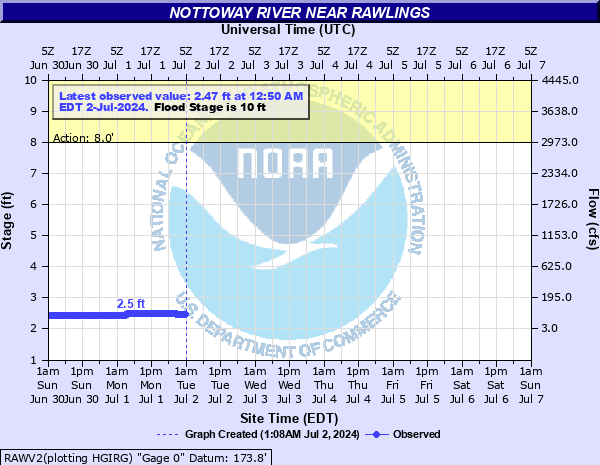
Nottoway River near Rawlings
Critical Stages
8' - Action
10' - Flood
13' - Moderate
16' - Major
Latest Observation
Updated: 5:50 PM EST 12/15/25
Status: No Flooding
Stage: 2.65 ft
Flow: 0.107 kcfs
Forecast
Forecast not available for this location.
| Time | Stage (ft) | Flow (kcfs) |
|---|---|---|
| 5:50 PM 12/15 | 2.65 | 0.107 |
| 5:45 PM 12/15 | 2.65 | 0.107 |
| 5:40 PM 12/15 | 2.66 | 0.109 |
| 5:35 PM 12/15 | 2.66 | 0.109 |
| 5:30 PM 12/15 | 2.66 | 0.109 |
| 5:25 PM 12/15 | 2.66 | 0.109 |
| 5:20 PM 12/15 | 2.66 | 0.109 |
| 5:15 PM 12/15 | 2.66 | 0.109 |
| 5:10 PM 12/15 | 2.66 | 0.109 |
| 4:50 PM 12/15 | 2.66 | 0.109 |
| 4:45 PM 12/15 | 2.66 | 0.109 |
| 4:40 PM 12/15 | 2.66 | 0.109 |
| 4:35 PM 12/15 | 2.66 | 0.109 |
| 4:30 PM 12/15 | 2.66 | 0.109 |
| 4:25 PM 12/15 | 2.66 | 0.109 |
| 4:20 PM 12/15 | 2.66 | 0.109 |
| 4:15 PM 12/15 | 2.66 | 0.109 |
| 4:10 PM 12/15 | 2.66 | 0.109 |
| 4:05 PM 12/15 | 2.66 | 0.109 |
| 4:00 PM 12/15 | 2.66 | 0.109 |
| 3:55 PM 12/15 | 2.66 | 0.109 |
| 3:50 PM 12/15 | 2.66 | 0.109 |
| 3:45 PM 12/15 | 2.66 | 0.109 |
| 3:40 PM 12/15 | 2.66 | 0.109 |
| 3:35 PM 12/15 | 2.66 | 0.109 |
| 3:30 PM 12/15 | 2.66 | 0.109 |
| 3:25 PM 12/15 | 2.66 | 0.109 |
| 3:20 PM 12/15 | 2.66 | 0.109 |
| 3:15 PM 12/15 | 2.66 | 0.109 |
| 3:10 PM 12/15 | 2.66 | 0.109 |
23.8' -
River stage sensor operating limit
16' -
WATER INUNDATES THE INTERSECTION OF HARPERS BRIDGE ROAD AND OLD BEAVER POND ROAD ABOUT A QUARTER MILE FROM THE GAGE. PORTIONS OF HARPERS BRIDGE ROAD INUNDATED WITH UP TO 4 FEET OF WATER ON NORTH SIDE OF THE RIVER. NO ACCESS TO BRIDGE FROM THE NORTH.
12' -
Water begins to flow across Harpers Bridge Road about an 1/8 of a mile north of the river. Farm land north of river along Beaver Pond Creek also floods.
10' -
River comes out of its banks in the vicinity of the gage.
| Date | Stage (ft) |
|---|---|
| Oct 6, 1972 | 23.25 |
| May 26, 2003 | 22.65 |
| Oct 24, 1971 | 21.36 |
| Oct 12, 2018 | 20.86 |
| Aug 17, 1940 | 20.8 |
| Aug 31, 2004 | 18.92 |
| Apr 27, 1978 | 17.58 |
| Apr 17, 1987 | 16.78 |
| Sep 20, 2003 | 16.77 |
| Nov 4, 1985 | 16.43 |
| Sep 23, 1979 | 15.76 |
| Mar 5, 1993 | 15.63 |
| Mar 20, 1998 | 15.26 |
| Feb 15, 1984 | 15.06 |
| Jul 16, 1975 | 14.39 |
| Sep 17, 1999 | 13.82 |
| May 17, 2014 | 13.81 |
| Mar 21, 2003 | 13.66 |
| Oct 1, 1979 | 13.48 |
| May 19, 2018 | 13.39 |
Data provided by the National Weather Service.