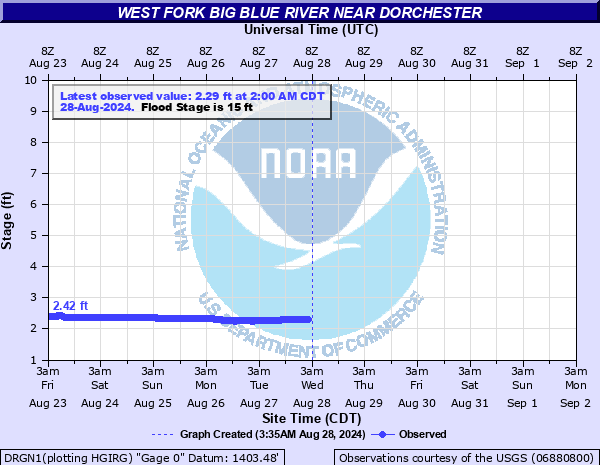
West Fork Big Blue River near Dorchester
Critical Stages
13' - Action
15' - Flood
22' - Moderate
24.4' - Major
Latest Observation
Updated: 5:00 PM CST 12/15/25
Status: No Flooding
Stage: 2.94 ft
Flow: 0.0637 kcfs
Forecast
Forecast not available for this location.
| Time | Stage (ft) | Flow (kcfs) |
|---|---|---|
| 5:00 PM 12/15 | 2.94 | 0.0637 |
| 4:45 PM 12/15 | 2.95 | 0.0644 |
| 4:30 PM 12/15 | 2.96 | 0.0651 |
| 4:15 PM 12/15 | 2.96 | 0.0651 |
| 4:00 PM 12/15 | 2.96 | 0.0651 |
| 3:45 PM 12/15 | 2.97 | 0.0658 |
| 3:30 PM 12/15 | 2.97 | 0.0658 |
| 3:15 PM 12/15 | 2.96 | 0.0651 |
| 3:00 PM 12/15 | 2.96 | 0.0651 |
| 2:45 PM 12/15 | 2.96 | 0.0651 |
| 2:30 PM 12/15 | 2.97 | 0.0658 |
| 2:15 PM 12/15 | 2.97 | 0.0658 |
| 2:00 PM 12/15 | 2.98 | 0.0666 |
| 1:45 PM 12/15 | 2.99 | 0.0673 |
| 1:30 PM 12/15 | 3 | 0.068 |
| 1:15 PM 12/15 | 3 | 0.068 |
| 1:00 PM 12/15 | 3.01 | 0.069 |
| 12:45 PM 12/15 | 3 | 0.068 |
| 12:30 PM 12/15 | 3 | 0.068 |
| 12:15 PM 12/15 | 2.99 | 0.0673 |
| 12:00 PM 12/15 | 2.98 | 0.0666 |
| 11:45 AM 12/15 | 2.97 | 0.0658 |
| 11:30 AM 12/15 | 2.97 | 0.0658 |
| 11:15 AM 12/15 | 2.96 | 0.0651 |
| 11:00 AM 12/15 | 2.95 | 0.0644 |
| 10:45 AM 12/15 | 2.94 | 0.0637 |
| 10:30 AM 12/15 | 2.93 | 0.063 |
| 10:15 AM 12/15 | 2.93 | 0.063 |
| 10:00 AM 12/15 | 2.93 | 0.063 |
| 9:45 AM 12/15 | 2.94 | 0.0637 |
30' -
Water is over the bridge.
28' -
Water reaches bottom of the concrete on the bridge.
25' -
The low steel of the bridge at the gage site is level with flood waters which are spreading out across the flood plain throughout the reach.
22' -
The county road about 500 feet north of the gage begins to flood.
18' -
Though only minor flooding is occurring at the gage, upstream near Beaver Crossing more severe flooding is likely ongoing.
15' -
Overflows commence along the low banks.
| Date | Stage (ft) |
|---|---|
| Jul 10, 1950 | 24.8 |
| Jul 1, 1986 | 22.62 |
| Mar 11, 1993 | 21.71 |
| Jun 8, 2015 | 21.24 |
| May 13, 2005 | 21.17 |
| Jul 22, 1990 | 20.58 |
| Mar 20, 1969 | 20.34 |
| Mar 30, 1960 | 20.28 |
| Mar 14, 2019 | 19.96 |
| Mar 25, 1987 | 19.51 |
| Jul 11, 1997 | 19.42 |
| Jun 4, 1991 | 19.21 |
| Apr 4, 1969 | 19.13 |
| May 22, 1984 | 18.82 |
| Jul 2, 1982 | 18.6 |
| Mar 7, 1979 | 18.43 |
| Jun 16, 1967 | 18.3 |
| Sep 1, 2014 | 18.07 |
| Jun 19, 1983 | 17.8 |
| Jun 11, 1999 | 17.71 |
Data provided by the National Weather Service.