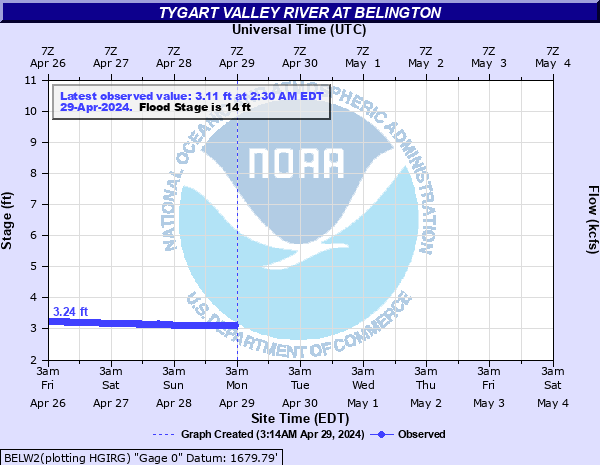
Tygart Valley River at Belington
Critical Stages
12' - Action
14' - Flood
17' - Moderate
20' - Major
Latest Observation
Updated: 5:30 PM EST 12/15/25
Status: No Flooding
Stage: 3.68 ft
Flow: 0.533 kcfs
Forecast
Forecast not available for this location.
| Time | Stage (ft) | Flow (kcfs) |
|---|---|---|
| 5:30 PM 12/15 | 3.68 | 0.533 |
| 5:15 PM 12/15 | 3.68 | 0.533 |
| 5:00 PM 12/15 | 3.67 | 0.528 |
| 4:45 PM 12/15 | 3.67 | 0.528 |
| 4:30 PM 12/15 | 3.68 | 0.533 |
| 4:15 PM 12/15 | 3.68 | 0.533 |
| 4:00 PM 12/15 | 3.68 | 0.533 |
| 3:45 PM 12/15 | 3.68 | 0.533 |
| 3:30 PM 12/15 | 3.69 | 0.538 |
| 3:15 PM 12/15 | 3.7 | 0.543 |
| 3:00 PM 12/15 | 3.7 | 0.543 |
| 2:45 PM 12/15 | 3.72 | 0.554 |
| 2:30 PM 12/15 | 3.72 | 0.554 |
| 2:15 PM 12/15 | 3.73 | 0.56 |
| 2:00 PM 12/15 | 3.74 | 0.565 |
| 1:45 PM 12/15 | 3.74 | 0.565 |
| 1:30 PM 12/15 | 3.75 | 0.571 |
| 1:15 PM 12/15 | 3.75 | 0.571 |
| 1:00 PM 12/15 | 3.76 | 0.576 |
| 12:45 PM 12/15 | 3.76 | 0.576 |
| 12:30 PM 12/15 | 3.75 | 0.571 |
| 12:15 PM 12/15 | 3.75 | 0.571 |
| 12:00 PM 12/15 | 3.76 | 0.576 |
| 11:45 AM 12/15 | 3.76 | 0.576 |
| 11:30 AM 12/15 | 3.77 | 0.582 |
| 11:15 AM 12/15 | 3.78 | 0.587 |
| 11:00 AM 12/15 | 3.79 | 0.593 |
| 10:45 AM 12/15 | 3.8 | 0.599 |
| 10:30 AM 12/15 | 3.8 | 0.599 |
| 10:15 AM 12/15 | 3.81 | 0.604 |
23.5' -
Major flooding of Belington. Many roads and businesses are flooded.
22' -
Approximately 15 homes along Dayton Loop near the gage flood.
20.5' -
Approximately 6 homes along Dayton Loop above Johnson Avenue intersection flood at 19 to 22 feet.
20' -
Intersection of Morgantown Pike and Crim Avenue flood at 19 to 21 feet.
19' -
Railroad tracks near Bridge Street bridge flood.
18' -
Dayton Loop near the gage floods.
17' -
Some city streets flood due to storm sewers backing up. Many low-lying areas flood.
15' -
Small bridge on Willow Street floods due to backwater into Mill Creek.
14' -
Intersection of Talbott Road and Wasbash Road flood.
13' -
Some basements begin to flood due to sewers backing up.
| Date | Stage (ft) |
|---|---|
| Nov 5, 1985 | 23.65 |
| Mar 14, 1927 | 22.6 |
| Jul 1, 1888 | 21.7 |
| Jul 24, 1912 | 20.3 |
| May 17, 1996 | 20.22 |
| Feb 9, 1994 | 19.25 |
| Mar 7, 1967 | 18.27 |
| Dec 31, 1969 | 17.82 |
| Oct 16, 1954 | 17.66 |
| Aug 1, 1996 | 17.51 |
| Jun 23, 1972 | 17.48 |
| May 8, 1994 | 17.38 |
| Mar 5, 2015 | 17.18 |
| Feb 19, 2000 | 17.13 |
| Jan 19, 1996 | 16.96 |
| Feb 7, 2004 | 16.93 |
| Apr 17, 2018 | 16.91 |
| Mar 21, 1982 | 16.55 |
| Mar 20, 1963 | 16.55 |
| Apr 4, 2024 | 16.38 |
Data provided by the National Weather Service.