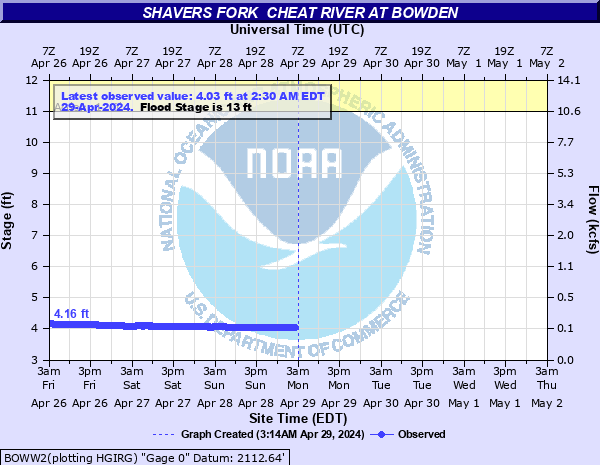
Shavers Fork Cheat River at Bowden
Critical Stages
11' - Action
13' - Flood
17.6' - Moderate
21.5' - Major
Latest Observation
Updated: 5:30 PM EST 12/15/25
Status: No Flooding
Stage: 3.76 ft
Flow: 0.0868 kcfs
Forecast
Forecast not available for this location.
| Time | Stage (ft) | Flow (kcfs) |
|---|---|---|
| 6:30 PM 12/15 | 3.77 | 0.0886 |
| 6:15 PM 12/15 | 3.77 | 0.0886 |
| 6:00 PM 12/15 | 3.77 | 0.0886 |
| 5:45 PM 12/15 | 3.76 | 0.0868 |
| 5:30 PM 12/15 | 3.76 | 0.0868 |
| 5:15 PM 12/15 | 3.76 | 0.0868 |
| 5:00 PM 12/15 | 3.76 | 0.0868 |
| 4:45 PM 12/15 | 3.77 | 0.0886 |
| 4:30 PM 12/15 | 3.77 | 0.0886 |
| 4:15 PM 12/15 | 3.77 | 0.0886 |
| 4:00 PM 12/15 | 3.78 | 0.0904 |
| 3:45 PM 12/15 | 3.79 | 0.0922 |
| 3:30 PM 12/15 | 3.8 | 0.094 |
| 3:15 PM 12/15 | 3.81 | 0.0957 |
| 3:00 PM 12/15 | 3.82 | 0.0974 |
| 2:45 PM 12/15 | 3.81 | 0.0957 |
| 2:30 PM 12/15 | 3.81 | 0.0957 |
| 2:15 PM 12/15 | 3.81 | 0.0957 |
| 2:00 PM 12/15 | 3.81 | 0.0957 |
| 1:45 PM 12/15 | 3.81 | 0.0957 |
| 1:30 PM 12/15 | 3.82 | 0.0974 |
| 1:15 PM 12/15 | 3.82 | 0.0974 |
| 1:00 PM 12/15 | 3.81 | 0.0957 |
| 12:45 PM 12/15 | 3.8 | 0.094 |
| 12:30 PM 12/15 | 3.79 | 0.0922 |
| 12:15 PM 12/15 | 3.78 | 0.0904 |
| 12:00 PM 12/15 | 3.78 | 0.0904 |
| 11:45 AM 12/15 | 3.79 | 0.0922 |
| 11:30 AM 12/15 | 3.81 | 0.0957 |
| 11:15 AM 12/15 | 3.82 | 0.0974 |
21.5' -
The Cheat River Resturant near the Old Route 33 highway bridge starts to get water on the lower floors. Most areas from Bowden to downstream of the Old Route 33 Bridges are flooded.
17.6' -
Several areas from Bowden to downstream of the Old Route 33 Bridge are flooded. The Old Route 33 and Route 5/12 bridges have water over them.
15' -
A campground as well as homes downstream from the old Route 33 highway bridges are flooded. Several areas along the river are flooded.
13.8' -
Campgrounds and homes are flooded. Water is over the Old Route 33, upstream from the highway bridge. Also a local convenience store starts to get water in it upstream from bridge.
13' -
Camps in and around Bowden start to flood. Water is at the bottom of the Old Route 33 Bridge as well as the Route 5/12 Bridge.
| Date | Stage (ft) |
|---|---|
| Apr 16, 2018 | 13.37 |
| Aug 29, 2013 | 13.22 |
| Jan 25, 2010 | 13.03 |
| Sep 30, 2016 | 12.75 |
| Mar 5, 2008 | 12.37 |
| Nov 19, 2003 | 12.37 |
| Jun 19, 1998 | 12.16 |
| Aug 23, 1989 | 11.5 |
| Mar 23, 1991 | 11.5 |
| Dec 26, 1973 | 11.47 |
| Apr 26, 1989 | 11.4 |
| Jan 31, 2013 | 11.16 |
| Jan 26, 1978 | 11.13 |
| Feb 19, 2000 | 11.08 |
| Mar 13, 1977 | 11.04 |
| Apr 22, 2002 | 10.93 |
| Nov 29, 2005 | 10.87 |
| Mar 28, 2005 | 10.74 |
| Aug 21, 1989 | 10.7 |
| Jun 24, 2016 | 10.17 |
Data provided by the National Weather Service.