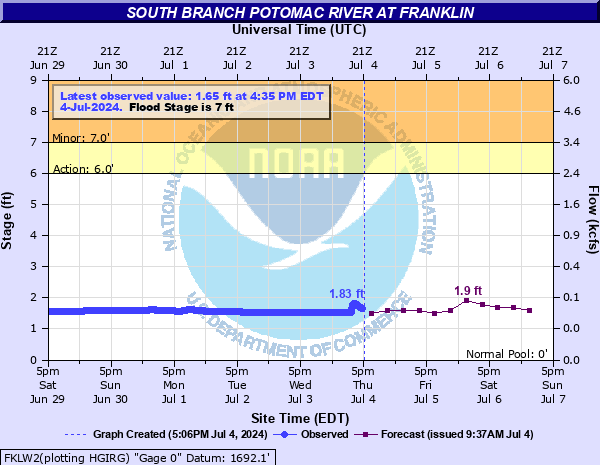
South Branch Potomac River at Franklin
Critical Stages
6' - Action
7' - Flood
9' - Moderate
11' - Major
Latest Observation
Updated: 6:05 PM EST 12/15/25
Status: No Flooding
Stage: 1.61 ft
Flow: 0.033 kcfs
Forecast
| Time | Stage (ft) | Flow (kcfs) |
|---|---|---|
| 7 PM 12/15 | 1.7 | 0.043 |
| 1 AM 12/16 | 1.7 | 0.043 |
| 7 AM 12/16 | 1.7 | 0.043 |
| 1 PM 12/16 | 1.7 | 0.043 |
| 7 PM 12/16 | 1.7 | 0.043 |
| 1 AM 12/17 | 1.7 | 0.043 |
| 7 AM 12/17 | 1.7 | 0.043 |
| 1 PM 12/17 | 1.7 | 0.043 |
| 7 PM 12/17 | 1.8 | 0.056 |
| 1 AM 12/18 | 1.9 | 0.072 |
| 7 AM 12/18 | 1.9 | 0.072 |
| Time | Stage (ft) | Flow (kcfs) |
|---|---|---|
| 6:35 PM 12/15 | 1.64 | 0.0361 |
| 6:30 PM 12/15 | 1.63 | 0.035 |
| 6:25 PM 12/15 | 1.63 | 0.035 |
| 6:20 PM 12/15 | 1.63 | 0.035 |
| 6:15 PM 12/15 | 1.62 | 0.034 |
| 6:10 PM 12/15 | 1.62 | 0.034 |
| 6:05 PM 12/15 | 1.61 | 0.033 |
| 6:00 PM 12/15 | 1.61 | 0.033 |
| 5:55 PM 12/15 | 1.61 | 0.033 |
| 5:50 PM 12/15 | 1.6 | 0.032 |
| 5:45 PM 12/15 | 1.6 | 0.032 |
| 5:40 PM 12/15 | 1.59 | 0.031 |
| 5:35 PM 12/15 | 1.59 | 0.031 |
| 5:30 PM 12/15 | 1.59 | 0.031 |
| 5:25 PM 12/15 | 1.58 | 0.03 |
| 5:20 PM 12/15 | 1.58 | 0.03 |
| 5:15 PM 12/15 | 1.58 | 0.03 |
| 5:10 PM 12/15 | 1.57 | 0.029 |
| 5:05 PM 12/15 | 1.57 | 0.029 |
| 5:00 PM 12/15 | 1.56 | 0.0281 |
| 4:55 PM 12/15 | 1.56 | 0.0281 |
| 4:50 PM 12/15 | 1.56 | 0.0281 |
| 4:45 PM 12/15 | 1.55 | 0.0272 |
| 4:40 PM 12/15 | 1.55 | 0.0272 |
| 4:35 PM 12/15 | 1.54 | 0.0263 |
| 4:30 PM 12/15 | 1.54 | 0.0263 |
| 4:25 PM 12/15 | 1.54 | 0.0263 |
| 4:20 PM 12/15 | 1.54 | 0.0263 |
| 4:15 PM 12/15 | 1.53 | 0.0255 |
| 4:10 PM 12/15 | 1.53 | 0.0255 |
13' -
The lowest end of the Route 220/12 bridge begins to flood.
11' -
Homes along Dickenson Mountain Road are flooded.
9' -
Several roads in or near Franklin are flooded, including Dickenson Mountain Road (Route 220/12), parts of US Route 220, County Route 220/13, and Taylor Hollow Road.
8' -
The Franklin city park begins to flood.
7' -
A low spot on Dickenson Mountain Road (Route 220/12) 300 feet downstream from the bridge begins to flood.
6.5' -
Water begins to cover Taylor Hollow Road in Franklin.
5' -
Water begins to overflow the low water crossing on County Route 220/12 at the south end of town.
| Date | Stage (ft) |
|---|---|
| Nov 4, 1985 | 22.58 |
| Sep 6, 1996 | 19.16 |
| Jan 19, 1996 | 16.06 |
| Nov 19, 2003 | 12.26 |
| Sep 19, 2003 | 12.14 |
| Jun 17, 1949 | 11.4 |
| May 17, 1996 | 9.98 |
| Apr 16, 1993 | 9.71 |
| Mar 2, 2007 | 9.52 |
| Jan 26, 1980 | 9.15 |
| Jan 26, 1978 | 9.15 |
| Jan 25, 2010 | 9.12 |
| Apr 16, 2018 | 9.1 |
| Jun 18, 2020 | 8.89 |
| Oct 9, 1976 | 8.72 |
| May 16, 1942 | 8.69 |
| Apr 16, 2011 | 8.66 |
| Aug 12, 1984 | 8.58 |
| Mar 7, 1967 | 8.45 |
| Mar 5, 1964 | 8.32 |
Data provided by the National Weather Service.