St. Joseph River (OH/IN) near Fort Wayne
Critical Stages
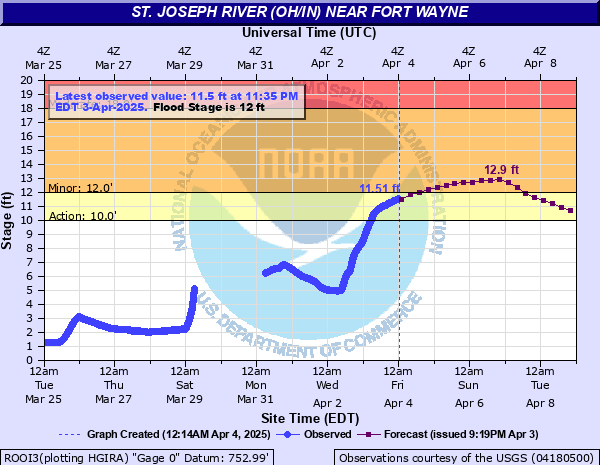
10' - Action
12' - Flood
18' - Moderate
20' - Major
Latest Observation
Updated: 11:40 PM EST 12/4/25
Status: No Flooding
Stage: 0.08 ft
Flow: -999 kcfs
Forecast
Forecast not available for this location.
| Time | Stage (ft) | Flow (kcfs) |
|---|---|---|
| 11:40 PM 12/4 | 0.08 | -999 |
| 11:35 PM 12/4 | 0.08 | -999 |
| 11:30 PM 12/4 | 0.08 | -999 |
| 11:25 PM 12/4 | 0.08 | -999 |
| 11:20 PM 12/4 | 0.08 | -999 |
| 11:15 PM 12/4 | 0.08 | -999 |
| 11:10 PM 12/4 | 0.08 | -999 |
| 11:05 PM 12/4 | 0.08 | -999 |
| 11:00 PM 12/4 | 0.08 | -999 |
| 10:55 PM 12/4 | 0.08 | -999 |
| 10:50 PM 12/4 | 0.08 | -999 |
| 10:45 PM 12/4 | 0.08 | -999 |
| 10:40 PM 12/4 | 0.08 | -999 |
| 10:35 PM 12/4 | 0.08 | -999 |
| 10:30 PM 12/4 | 0.08 | -999 |
| 10:25 PM 12/4 | 0.08 | -999 |
| 10:20 PM 12/4 | 0.08 | -999 |
| 10:15 PM 12/4 | 0.08 | -999 |
| 10:10 PM 12/4 | 0.08 | -999 |
| 10:05 PM 12/4 | 0.08 | -999 |
| 10:00 PM 12/4 | 0.08 | -999 |
| 9:55 PM 12/4 | 0.08 | -999 |
| 9:50 PM 12/4 | 0.08 | -999 |
| 9:45 PM 12/4 | 0.08 | -999 |
| 9:40 PM 12/4 | 0.08 | -999 |
| 9:35 PM 12/4 | 0.08 | -999 |
| 9:30 PM 12/4 | 0.08 | -999 |
| 9:25 PM 12/4 | 0.08 | -999 |
| 9:20 PM 12/4 | 0.08 | -999 |
| 9:15 PM 12/4 | 0.09 | -999 |
20' -
A major flood is in progress and water nears the top of uncertified levees.
19' -
An increasing number of city streets flood with a few homes in Concordia Gardens affected by high water.
18' -
The city of Fort Wayne starts monitoring all potential flood sites on the St. Joseph River. Some residents in low lying areas and Canterbury Green Apartments will be affected by high water.
17' -
Flooding occurs in parks and low farmland throughout northeast Allen County. Flooding occurs on the lowest unprotected city streets...park drives and county roads.
15' -
Flooding of lowland and farmland near the river increases.
12' -
Lowland and farmland flooding near the river begins.
| Date | Stage (ft) |
|---|---|
| Mar 26, 1913 | 22 |
| Mar 12, 2009 | 20.38 |
| May 19, 1996 | 18.1 |
| Apr 7, 1950 | 17.9 |
| Jun 5, 1989 | 17.86 |
| Feb 26, 1985 | 17.79 |
| Dec 1, 2011 | 17.67 |
| Dec 31, 1990 | 17.51 |
| Feb 7, 2008 | 17.37 |
| Jan 5, 1993 | 17.15 |
| May 18, 1943 | 16.7 |
| Jan 9, 2008 | 16.38 |
| Apr 12, 1944 | 16.18 |
| May 20, 1945 | 16.07 |
| Apr 20, 2013 | 16.01 |
| Jan 25, 1999 | 15.71 |
| Feb 24, 1990 | 15.08 |
| May 22, 2010 | 14.88 |
| May 27, 2011 | 14.48 |
| Jan 14, 2005 | 14.41 |
Data provided by the National Weather Service.