St. Marys River near Fort Wayne
Critical Stages
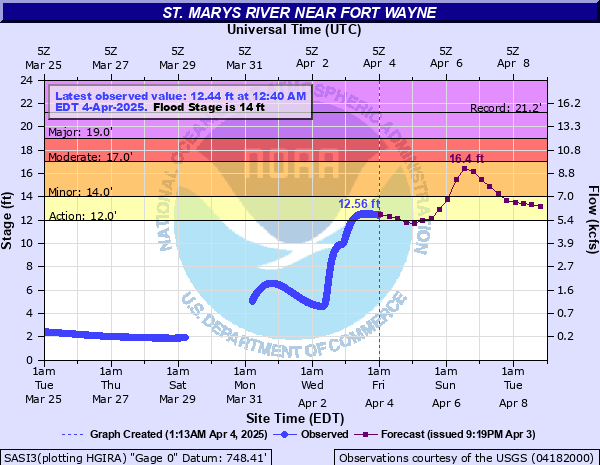
12' - Action
14' - Flood
17' - Moderate
19' - Major
Latest Observation
Updated: 11:45 PM EST 12/4/25
Status: No Flooding
Stage: 1.05 ft
Flow: 0.0526 kcfs
Forecast
Forecast not available for this location.
| Time | Stage (ft) | Flow (kcfs) |
|---|---|---|
| 11:45 PM 12/4 | 1.05 | 0.0526 |
| 11:40 PM 12/4 | 1.06 | 0.0537 |
| 11:35 PM 12/4 | 1.06 | 0.0537 |
| 11:30 PM 12/4 | 1.05 | 0.0526 |
| 11:25 PM 12/4 | 1.06 | 0.0537 |
| 11:20 PM 12/4 | 1.06 | 0.0537 |
| 11:15 PM 12/4 | 1.06 | 0.0537 |
| 11:10 PM 12/4 | 1.06 | 0.0537 |
| 11:05 PM 12/4 | 1.06 | 0.0537 |
| 11:00 PM 12/4 | 1.06 | 0.0537 |
| 10:55 PM 12/4 | 1.06 | 0.0537 |
| 10:50 PM 12/4 | 1.06 | 0.0537 |
| 10:45 PM 12/4 | 1.06 | 0.0537 |
| 10:40 PM 12/4 | 1.06 | 0.0537 |
| 10:35 PM 12/4 | 1.05 | 0.0526 |
| 10:30 PM 12/4 | 1.06 | 0.0537 |
| 10:25 PM 12/4 | 1.06 | 0.0537 |
| 10:20 PM 12/4 | 1.06 | 0.0537 |
| 10:15 PM 12/4 | 1.06 | 0.0537 |
| 10:10 PM 12/4 | 1.06 | 0.0537 |
| 10:05 PM 12/4 | 1.06 | 0.0537 |
| 10:00 PM 12/4 | 1.06 | 0.0537 |
| 9:55 PM 12/4 | 1.06 | 0.0537 |
| 9:50 PM 12/4 | 1.06 | 0.0537 |
| 9:45 PM 12/4 | 1.06 | 0.0537 |
| 9:40 PM 12/4 | 1.06 | 0.0537 |
| 9:35 PM 12/4 | 1.06 | 0.0537 |
| 9:30 PM 12/4 | 1.06 | 0.0537 |
| 9:25 PM 12/4 | 1.06 | 0.0537 |
| 9:20 PM 12/4 | 1.06 | 0.0537 |
22' -
Structural damage is done to homes and businesses on the south side of Fort Wayne near the Saint Mary's River. Record flood was set on July 9, 2003 when the river reached 21.2 feet.
20' -
A major flood is in progress and water is nearing the top of many levees.
19' -
Flooding reaching major category with isolated evacuations becoming necessary. Some roads and bridges are closed at this level.
18' -
An increasing number of city streets flood, and evacuations may become necessary. Property damage begins in more areas at this level.
17' -
Some residents in the Winchester Road area may need to be evacuated. Property damage begins in some areas at this level.
15' -
Flooding occurs on the lowest unprotected city streets, park drives and county roads.
14' -
Flooding occurs in parks and low farmland throughout southern Allen County. The City of Fort Wayne starts 24 hour flood fighting procedures.
| Date | Stage (ft) |
|---|---|
| Jul 9, 2003 | 21.2 |
| Jun 19, 2015 | 19.88 |
| Mar 14, 1982 | 19.66 |
| Jan 14, 2005 | 19.06 |
| Feb 26, 1985 | 18.33 |
| Jan 1, 1991 | 17.92 |
| Feb 9, 2008 | 17.68 |
| Feb 9, 2008 | 17.67 |
| Jul 18, 1992 | 17.07 |
| Jan 26, 1999 | 17.03 |
| Mar 11, 2009 | 16.97 |
| Jan 15, 2013 | 16.83 |
| Feb 13, 2009 | 16.06 |
| May 27, 2017 | 15.89 |
| May 27, 2017 | 15.89 |
| May 12, 2003 | 15.81 |
| Jun 29, 2015 | 15.74 |
| Mar 8, 1963 | 15.62 |
| Jun 14, 2004 | 15.48 |
| Apr 29, 2019 | 15.27 |
Data provided by the National Weather Service.