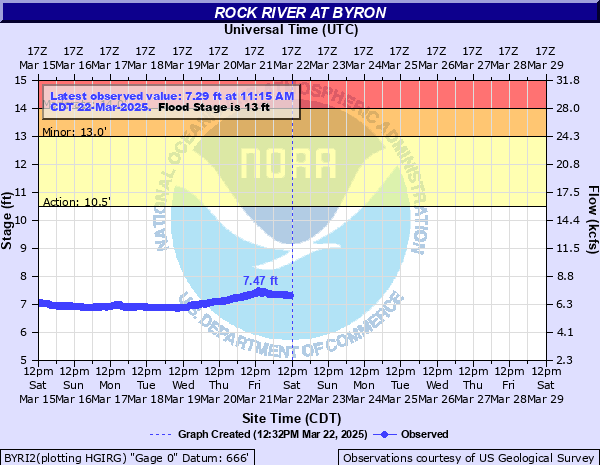
Rock River at Byron
Critical Stages
10.5' - Action
13' - Flood
14' - Moderate
16' - Major
Latest Observation
Updated: 5:15 AM CST 12/12/25
Status: No Flooding
Stage: 6.09 ft
Flow: 4.3 kcfs
Forecast
Forecast not available for this location.
| Time | Stage (ft) | Flow (kcfs) |
|---|---|---|
| 5:15 AM 12/12 | 6.09 | 4.3 |
| 5:00 AM 12/12 | 6.09 | 4.3 |
| 4:45 AM 12/12 | 6.09 | 4.3 |
| 4:30 AM 12/12 | 6.09 | 4.3 |
| 4:15 AM 12/12 | 6.09 | 4.3 |
| 4:00 AM 12/12 | 6.09 | 4.3 |
| 3:45 AM 12/12 | 6.09 | 4.3 |
| 3:30 AM 12/12 | 6.09 | 4.3 |
| 3:15 AM 12/12 | 6.1 | 4.32 |
| 3:00 AM 12/12 | 6.1 | 4.32 |
| 2:45 AM 12/12 | 6.1 | 4.32 |
| 2:30 AM 12/12 | 6.1 | 4.32 |
| 2:15 AM 12/12 | 6.1 | 4.32 |
| 2:00 AM 12/12 | 6.11 | 4.34 |
| 1:45 AM 12/12 | 6.11 | 4.34 |
| 1:30 AM 12/12 | 6.11 | 4.34 |
| 1:15 AM 12/12 | 6.11 | 4.34 |
| 1:00 AM 12/12 | 6.11 | 4.34 |
| 12:45 AM 12/12 | 6.11 | 4.34 |
| 12:30 AM 12/12 | 6.11 | 4.34 |
| 12:15 AM 12/12 | 6.12 | 4.36 |
| 12:00 AM 12/12 | 6.12 | 4.36 |
| 11:45 PM 12/11 | 6.11 | 4.34 |
| 11:30 PM 12/11 | 6.12 | 4.36 |
| 11:15 PM 12/11 | 6.12 | 4.36 |
| 11:00 PM 12/11 | 6.12 | 4.36 |
| 10:45 PM 12/11 | 6.12 | 4.36 |
| 10:30 PM 12/11 | 6.12 | 4.36 |
| 10:15 PM 12/11 | 6.12 | 4.36 |
| 10:00 PM 12/11 | 6.12 | 4.36 |
17' -
Water threatens structures at the water treatment plant in Byron.
16.5' -
Numerous residences are threatened between IL-2 and the river just northeast of Byron. River Road is threatened near the river just south of Byron.
16' -
The MercyHealth Clinic is threatened along Kysor Drive in Byron.
15.5' -
Water threatens lower sections of the water treatment plant property in Byron. Water threatens IL-2 west of Byron.
13.5' -
Numerous low-lying structures downstream of Byron are flooded.
13' -
Low-lying structures downstream of Byron are threatened.
12' -
Water inundates yards of several houses along River Road near Byron. Low-lying portions of Hamas Park and Sunshine Park are inundated.
10.5' -
Water begins to affect low-lying areas along the river near Byron.
| Date | Stage (ft) |
|---|---|
| Apr 20, 1973 | 17.8 |
| Apr 20, 2013 | 17.08 |
| Mar 16, 2019 | 16.64 |
| Jul 25, 2010 | 16.5 |
| Jun 14, 2000 | 16.12 |
| Oct 8, 2018 | 15.67 |
| Aug 25, 2007 | 15.52 |
| Jul 22, 2017 | 15.38 |
| Feb 22, 2018 | 15.15 |
| Mar 25, 1975 | 15 |
| Jun 15, 2008 | 14.81 |
| Mar 21, 1979 | 14.7 |
| Apr 5, 1959 | 14.7 |
| Jun 5, 2002 | 14.67 |
| Oct 4, 2019 | 14.42 |
| Sep 5, 2018 | 14.28 |
| Jul 16, 2024 | 13.84 |
| Mar 11, 2009 | 13.66 |
| Sep 15, 2019 | 13.53 |
| Jun 13, 2004 | 13.19 |
Data provided by the National Weather Service.