« Back to Delta Knolls Golf Center Rivers
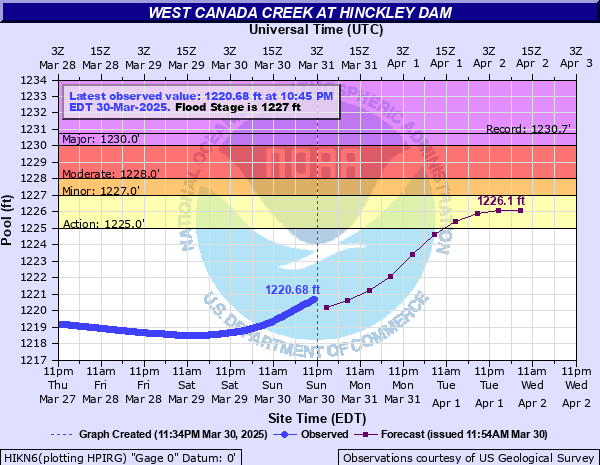
West Canada Creek at Hinckley Dam
Critical Stages
1225' - Action
1227' - Flood
1228' - Moderate
1230' - Major
Latest Observation
Updated: 8:45 AM EST 12/6/25
Status: No Flooding
Stage: 1207.89 ft
Flow: -999 kcfs
Forecast
| Time | Stage (ft) | Flow (kcfs) |
|---|---|---|
| 1 PM 12/6 | 1207.9 | -999 |
| 7 PM 12/6 | 1207.7 | -999 |
| 1 AM 12/7 | 1207.6 | -999 |
| 7 AM 12/7 | 1207.5 | -999 |
| 1 PM 12/7 | 1207.3 | -999 |
| 7 PM 12/7 | 1207.2 | -999 |
| 1 AM 12/8 | 1207.1 | -999 |
| 7 AM 12/8 | 1206.9 | -999 |
| Time | Stage (ft) | Flow (kcfs) |
|---|---|---|
| 8:45 AM 12/6 | 1207.89 | -999 |
| 8:30 AM 12/6 | 1207.89 | -999 |
| 8:15 AM 12/6 | 1207.9 | -999 |
| 8:00 AM 12/6 | 1207.9 | -999 |
| 7:45 AM 12/6 | 1207.91 | -999 |
| 7:30 AM 12/6 | 1207.91 | -999 |
| 7:15 AM 12/6 | 1207.92 | -999 |
| 7:00 AM 12/6 | 1207.93 | -999 |
| 6:45 AM 12/6 | 1207.93 | -999 |
| 6:30 AM 12/6 | 1207.94 | -999 |
| 6:15 AM 12/6 | 1207.94 | -999 |
| 6:00 AM 12/6 | 1207.95 | -999 |
| 5:45 AM 12/6 | 1207.95 | -999 |
| 5:30 AM 12/6 | 1207.96 | -999 |
| 5:15 AM 12/6 | 1207.97 | -999 |
| 5:00 AM 12/6 | 1207.97 | -999 |
| 4:45 AM 12/6 | 1207.98 | -999 |
| 4:30 AM 12/6 | 1207.98 | -999 |
| 4:15 AM 12/6 | 1207.99 | -999 |
| 4:00 AM 12/6 | 1207.99 | -999 |
| 3:45 AM 12/6 | 1208 | -999 |
| 3:30 AM 12/6 | 1208 | -999 |
| 3:15 AM 12/6 | 1208.01 | -999 |
| 3:00 AM 12/6 | 1208.02 | -999 |
| 2:45 AM 12/6 | 1208.02 | -999 |
| 2:30 AM 12/6 | 1208.02 | -999 |
| 2:15 AM 12/6 | 1208.03 | -999 |
| 2:00 AM 12/6 | 1208.04 | -999 |
| 1:45 AM 12/6 | 1208.04 | -999 |
| 1:30 AM 12/6 | 1208.05 | -999 |
1230' -
Major flood stage.
1228' -
Moderate flood stage. Three feet of water are spilling over and there is widespread flooding downstream between Hinckley and Herkimer.
1227' -
Minor flood stage with two feet of water flowing over the spillway. The river overflows its banks downstream.
1226' -
One foot of water is flowing over the spillway.
1225.5' -
Six inches of water are flowing over the spillway.
1225' -
Action stage as water reaches the spillway and begins to flow over.
| Date | Stage (ft) |
|---|---|
| Nov 1, 2019 | 1231.49 |
| Apr 28, 2011 | 1230.73 |
| Oct 2, 1945 | 1230.2 |
| Jun 29, 2006 | 1229.85 |
| Apr 16, 2014 | 1229.05 |
| May 4, 1972 | 1228.7 |
| Apr 28, 1980 | 1228.7 |
| Apr 17, 1993 | 1228.4 |
| May 25, 2004 | 1228.15 |
| Apr 21, 2019 | 1228.05 |
| Jul 3, 2013 | 1228.02 |
| Dec 28, 1973 | 1228 |
| Mar 18, 1990 | 1227.9 |
| May 19, 1973 | 1227.9 |
| Apr 25, 2001 | 1227.9 |
| Apr 20, 1969 | 1227.9 |
| Apr 26, 1994 | 1227.8 |
| Apr 7, 1989 | 1227.6 |
| Apr 9, 2022 | 1227.57 |
| Apr 29, 1970 | 1227.5 |
Data provided by the National Weather Service.