« Back to Delta Knolls Golf Center Rivers
Oneida Creek at Oneida
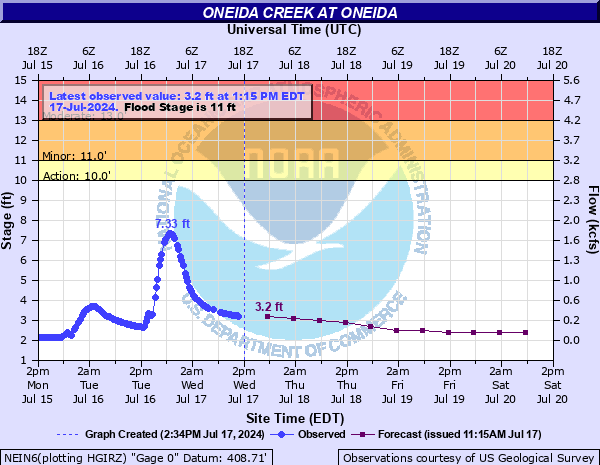
Critical Stages
10' - Action
11' - Flood
13' - Moderate
15' - Major
Latest Observation
Updated: 8:15 AM EST 12/6/25
Status: No Flooding
Stage: 2.86 ft
Flow: 0.125 kcfs
Forecast
| Time | Stage (ft) | Flow (kcfs) |
|---|---|---|
| 1 PM 12/6 | 2.6 | 0.073 |
| 7 PM 12/6 | 2.6 | 0.073 |
| 1 AM 12/7 | 2.6 | 0.073 |
| 7 AM 12/7 | 2.6 | 0.073 |
| 1 PM 12/7 | 2.6 | 0.073 |
| 7 PM 12/7 | 2.6 | 0.073 |
| 1 AM 12/8 | 2.6 | 0.073 |
| 7 AM 12/8 | 2.6 | 0.073 |
| Time | Stage (ft) | Flow (kcfs) |
|---|---|---|
| 8:15 AM 12/6 | 2.86 | 0.125 |
| 8:00 AM 12/6 | 2.86 | 0.125 |
| 7:45 AM 12/6 | 2.85 | 0.123 |
| 7:30 AM 12/6 | 2.85 | 0.123 |
| 7:15 AM 12/6 | 2.85 | 0.123 |
| 7:00 AM 12/6 | 2.86 | 0.125 |
| 6:45 AM 12/6 | 2.86 | 0.125 |
| 6:30 AM 12/6 | 2.86 | 0.125 |
| 6:15 AM 12/6 | 2.86 | 0.125 |
| 6:00 AM 12/6 | 2.86 | 0.125 |
| 5:45 AM 12/6 | 2.86 | 0.125 |
| 5:30 AM 12/6 | 2.86 | 0.125 |
| 5:15 AM 12/6 | 2.86 | 0.125 |
| 5:00 AM 12/6 | 2.86 | 0.125 |
| 4:45 AM 12/6 | 2.86 | 0.125 |
| 4:30 AM 12/6 | 2.86 | 0.125 |
| 4:15 AM 12/6 | 2.86 | 0.125 |
| 4:00 AM 12/6 | 2.86 | 0.125 |
| 3:45 AM 12/6 | 2.86 | 0.125 |
| 3:30 AM 12/6 | 2.86 | 0.125 |
| 3:15 AM 12/6 | 2.87 | 0.128 |
| 3:00 AM 12/6 | 2.87 | 0.128 |
| 2:45 AM 12/6 | 2.88 | 0.13 |
| 2:30 AM 12/6 | 2.88 | 0.13 |
| 2:15 AM 12/6 | 2.89 | 0.133 |
| 2:00 AM 12/6 | 2.89 | 0.133 |
| 1:45 AM 12/6 | 2.89 | 0.133 |
| 1:30 AM 12/6 | 2.89 | 0.133 |
| 1:15 AM 12/6 | 2.89 | 0.133 |
| 1:00 AM 12/6 | 2.89 | 0.133 |
20.2' -
FEMA flood insurance risk maps indicate that this is the 0.2% (500 year) flood level. Your property is at risk for flooding during a record flood event. A 500 year flood is a flood that has a 0.2 percent chance of occurring in any year. A flood of this magnitude has not occurred since record keeping began.
17.6' -
This is the stage that would reach the bottom of the Genessee Street Bridge.
17.23' -
Record Flood of June 28, 2013. Flooding, several feet deep, extends well into the City of Oneida, affecting areas almost to Cedar Street, MacArthur Parkway and S. Lake Street. There is widespread flood devastation at this level for many residences, businesses and city infrastructure.
17.1' -
FEMA flood insurance risk maps indicate that this is the 1% (100 year) floodplain. Your property is at risk for flooding during a major flood event. A 100 year flood is a flood that has a 1 percent chance of occurring in any year. In the past, water has reached this level one time since 1950.
15.6' -
This is the Tropical Storm Lee 2011 flood level. Widespread and significant flooding occurred throughout the Flats area in the City of Oneida, and also in Oneida Castle adn the Towns of Vernon and Verona. This was a serious flood with extensive damage to business and residential areas.
15' -
Major Flood Stage. Between 15 and 15.5 feet, overbanking occurs and rapidly spreads into the City of Oneida with water flowing across Devereaux Street, Sconondoa Street, Wilson Street and the lower part of Stevens, Lenox and Prospect Streets. At this flood stage, several homes and businesses are affected by severe flooding of basements and the first floor level.
14.6' -
This is the 1972 Hurricane Agnes flood level. Flood waters reached the low spots along E. Walnut Street and Wilson Street Shopping Center. Water was knee deep in this area during the flood.
14.1' -
At this level, water can reach the bottom of the Bennett Road Bridge.
14' -
Stormwater runoff begins to pool in areas around Carinci Park, and in locations between Sconondoa Street and the abandoned railroad tracks. Water begins to flood the Oneida Animal Hospital, and evacuation of animals and personnel has occurred in the past.
13.3' -
Water at this level would equal the June 28, 2006 flood.
13' -
Moderate Flood Stage. Flooding spreads into the mobile home park off of Highland Street in Oneida Castle. Some homes are also affected on the south side of Prospect Street near Highland Street.
12' -
Maxwell Field and the lower portion of E. Sands Street are flooded.
11.5' -
Water spreads across Highland Avenue, cutting off some residences from accessing Prospect Street. Low lying areas in the Town of Verona north of Sconondoa Street flood as water backs up along Sconondoa Creek.
11' -
Flood Stage. Low lying areas in the Town of Verona, and near Oneida Castle, flood. No homes, businesses, or infrastructure are affected.
10' -
Action Stage. The river stage at which some initial planning and preparation by local emergency officials takes place.
| Date | Stage (ft) |
|---|---|
| Jun 28, 2013 | 17.23 |
| Jul 2, 2017 | 15.76 |
| Sep 8, 2011 | 15.55 |
| Jun 22, 2025 | 15.11 |
| Oct 9, 1976 | 15.01 |
| Jun 22, 1972 | 14.61 |
| Jan 19, 1996 | 14.51 |
| Mar 15, 1986 | 14.45 |
| Mar 5, 1979 | 14.42 |
| Jan 22, 1959 | 14.3 |
| Mar 28, 1950 | 13.78 |
| Nov 1, 2019 | 13.66 |
| Dec 18, 2023 | 13.39 |
| Jun 28, 2006 | 13.34 |
| Aug 4, 1957 | 13.3 |
| Mar 30, 2014 | 13.05 |
| Mar 15, 2007 | 12.96 |
| Jan 24, 1999 | 12.9 |
| Mar 30, 1960 | 12.71 |
| May 14, 2000 | 12.56 |
Data provided by the National Weather Service.