Flat River at Smyrna
Critical Stages
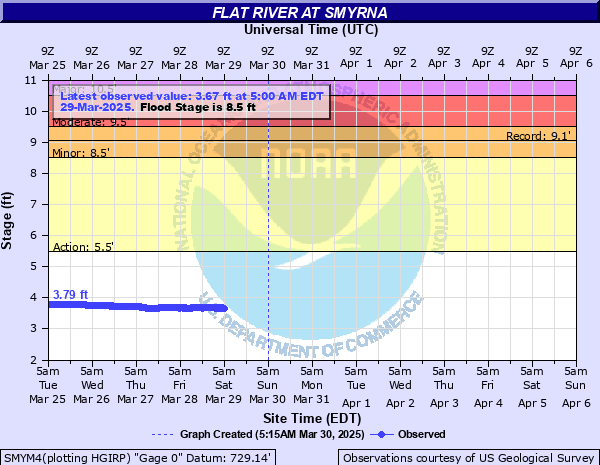
5.5' - Action
8.5' - Flood
9.5' - Moderate
10.5' - Major
Latest Observation
Updated: 11:00 PM EST 12/14/25
Status: No Flooding
Stage: 3.07 ft
Flow: 0.143 kcfs
Forecast
Forecast not available for this location.
| Time | Stage (ft) | Flow (kcfs) |
|---|---|---|
| 11:00 PM 12/14 | 3.07 | 0.143 |
| 10:45 PM 12/14 | 3.05 | 0.139 |
| 10:30 PM 12/14 | 3.04 | 0.137 |
| 10:15 PM 12/14 | 3.03 | 0.135 |
| 10:00 PM 12/14 | 3.02 | 0.134 |
| 9:45 PM 12/14 | 3.02 | 0.134 |
| 9:30 PM 12/14 | 3.01 | 0.132 |
| 9:15 PM 12/14 | 3.01 | 0.132 |
| 9:00 PM 12/14 | 3.01 | 0.132 |
| 8:45 PM 12/14 | 3.01 | 0.132 |
| 8:30 PM 12/14 | 3.02 | 0.134 |
| 8:15 PM 12/14 | 3.02 | 0.134 |
| 8:00 PM 12/14 | 3.03 | 0.135 |
| 7:45 PM 12/14 | 3.03 | 0.135 |
| 7:30 PM 12/14 | 3.04 | 0.137 |
| 7:15 PM 12/14 | 3.04 | 0.137 |
| 7:00 PM 12/14 | 3.05 | 0.139 |
| 6:45 PM 12/14 | 3.05 | 0.139 |
| 6:30 PM 12/14 | 3.06 | 0.141 |
| 6:15 PM 12/14 | 3.06 | 0.141 |
| 6:00 PM 12/14 | 3.07 | 0.143 |
| 5:45 PM 12/14 | 3.08 | 0.145 |
| 5:30 PM 12/14 | 3.08 | 0.145 |
| 5:15 PM 12/14 | 3.09 | 0.147 |
| 5:00 PM 12/14 | 3.09 | 0.147 |
| 4:45 PM 12/14 | 3.1 | 0.149 |
| 4:30 PM 12/14 | 3.1 | 0.149 |
| 4:15 PM 12/14 | 3.11 | 0.151 |
| 4:00 PM 12/14 | 3.11 | 0.151 |
| 3:45 PM 12/14 | 3.11 | 0.151 |
9.05' -
Expect major flooding of campground sites and evacuation of campers in Double R Ranch Campground during the camping season. Approximately a dozen homes have water in their basements.
8.5' -
Flooding begins to impact homes and flood basements in low lying areas along the river.
7' -
Expect minor flooding of about 30 Double R Ranch Campground sites and in low lying areas adjacent to the river.
6' -
Expect minor flooding of low lying areas adjacent to the river and Double R Ranch Campground.
5.5' -
River is bankfull. Overflow begins in low areas adjacent to the river.
| Date | Stage (ft) |
|---|---|
| Sep 13, 1986 | 9.05 |
| Jan 22, 2005 | 8.5 |
| Dec 22, 2000 | 7.84 |
| Jan 26, 2005 | 7.77 |
| Jan 16, 1997 | 7.72 |
| Dec 24, 2008 | 7.71 |
| Apr 20, 2013 | 7.53 |
| Feb 21, 1994 | 7.29 |
| Apr 22, 1967 | 7.27 |
| Apr 12, 1965 | 7.2 |
| Mar 7, 1976 | 7.19 |
| May 20, 2020 | 7.01 |
| Jan 23, 2004 | 6.88 |
| Mar 17, 2019 | 6.87 |
| May 12, 2004 | 6.83 |
| Apr 1, 1960 | 6.81 |
| May 9, 1956 | 6.75 |
| Apr 4, 1959 | 6.74 |
| Oct 2, 1981 | 6.72 |
| Jul 22, 1957 | 6.65 |
Data provided by the National Weather Service.