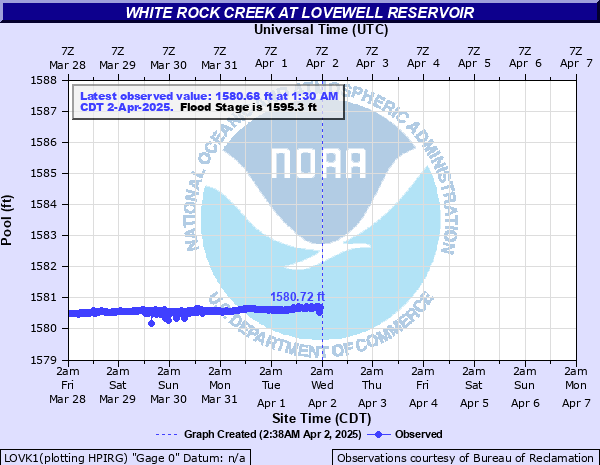
White Rock Creek at Lovewell Reservoir
Critical Stages
1589.8' - Action
1595.3' - Flood
Moderate
1611' - Major
Latest Observation
Updated: 3:30 AM CST 12/16/25
Status: No Flooding
Stage: 1579.1 ft
Flow: -999 kcfs
Forecast
Forecast not available for this location.
| Time | Stage (ft) | Flow (kcfs) |
|---|---|---|
| 3:30 AM 12/16 | 1579.1 | -999 |
| 3:15 AM 12/16 | 1579.1 | -999 |
| 3:00 AM 12/16 | 1579.1 | -999 |
| 2:45 AM 12/16 | 1579.1 | -999 |
| 2:30 AM 12/16 | 1579.09 | -999 |
| 2:15 AM 12/16 | 1579.1 | -999 |
| 2:00 AM 12/16 | 1579.1 | -999 |
| 1:45 AM 12/16 | 1579.1 | -999 |
| 1:30 AM 12/16 | 1579.1 | -999 |
| 1:15 AM 12/16 | 1579.1 | -999 |
| 1:00 AM 12/16 | 1579.1 | -999 |
| 12:45 AM 12/16 | 1579.1 | -999 |
| 12:30 AM 12/16 | 1579.1 | -999 |
| 12:15 AM 12/16 | 1579.1 | -999 |
| 12:00 AM 12/16 | 1579.1 | -999 |
| 11:45 PM 12/15 | 1579.1 | -999 |
| 11:30 PM 12/15 | 1579.1 | -999 |
| 11:15 PM 12/15 | 1579.11 | -999 |
| 11:00 PM 12/15 | 1579.1 | -999 |
| 10:45 PM 12/15 | 1579.1 | -999 |
| 10:30 PM 12/15 | 1579.11 | -999 |
| 10:15 PM 12/15 | 1579.1 | -999 |
| 10:00 PM 12/15 | 1579.1 | -999 |
| 9:45 PM 12/15 | 1579.1 | -999 |
| 9:30 PM 12/15 | 1579.1 | -999 |
| 9:15 PM 12/15 | 1579.11 | -999 |
| 9:00 PM 12/15 | 1579.11 | -999 |
| 8:45 PM 12/15 | 1579.1 | -999 |
| 8:30 PM 12/15 | 1579.11 | -999 |
| 8:15 PM 12/15 | 1579.1 | -999 |
1616' -
This elevation represents the height, or crest, of the dam.
1610.3' -
This elevation represents the maximum surcharge at this reservoir.
1595.3' -
This elevation represents the top of the flood control pool.
1582.6' -
This elevation represents the bottom of the flood control pool.
1575.3' -
This is the elevation of the gated spillway crest.
1571.7' -
This elevation represents the bottom of the conservation pool.
| Date | Stage (ft) |
|---|---|
| Jul 22, 1993 | 1595.38 |
| May 17, 1986 | 1585.82 |
Data provided by the National Weather Service.