East Fork Angelina River near Cushing
Critical Stages
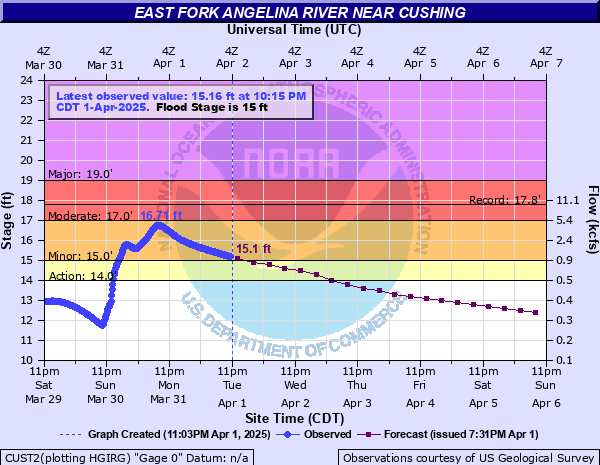
14' - Action
15' - Flood
17' - Moderate
19' - Major
Latest Observation
Updated: 8:15 PM CST 12/8/25
Status: No Flooding
Stage: 7.99 ft
Flow: 0.0307 kcfs
Forecast
Forecast not available for this location.
| Time | Stage (ft) | Flow (kcfs) |
|---|---|---|
| 8:15 PM 12/8 | 7.99 | 0.0307 |
| 8:00 PM 12/8 | 7.99 | 0.0307 |
| 7:45 PM 12/8 | 7.99 | 0.0307 |
| 7:30 PM 12/8 | 7.99 | 0.0307 |
| 7:15 PM 12/8 | 7.99 | 0.0307 |
| 7:00 PM 12/8 | 7.99 | 0.0307 |
| 6:45 PM 12/8 | 7.99 | 0.0307 |
| 6:30 PM 12/8 | 8 | 0.031 |
| 6:15 PM 12/8 | 8 | 0.031 |
| 6:00 PM 12/8 | 8 | 0.031 |
| 5:45 PM 12/8 | 8 | 0.031 |
| 5:30 PM 12/8 | 8 | 0.031 |
| 5:15 PM 12/8 | 8 | 0.031 |
| 5:00 PM 12/8 | 8 | 0.031 |
| 4:45 PM 12/8 | 8 | 0.031 |
| 4:30 PM 12/8 | 8 | 0.031 |
| 4:15 PM 12/8 | 8 | 0.031 |
| 4:00 PM 12/8 | 8 | 0.031 |
| 3:45 PM 12/8 | 8 | 0.031 |
| 3:30 PM 12/8 | 8 | 0.031 |
| 3:15 PM 12/8 | 8 | 0.031 |
| 3:00 PM 12/8 | 8.01 | 0.0313 |
| 2:45 PM 12/8 | 8.01 | 0.0313 |
| 2:30 PM 12/8 | 8.01 | 0.0313 |
| 2:15 PM 12/8 | 8.01 | 0.0313 |
| 2:00 PM 12/8 | 8.01 | 0.0313 |
| 1:45 PM 12/8 | 8.01 | 0.0313 |
| 1:30 PM 12/8 | 8.01 | 0.0313 |
| 1:15 PM 12/8 | 8.01 | 0.0313 |
| 1:00 PM 12/8 | 8.02 | 0.0316 |
23' -
High water begins overflowing the Farm to Market 225 highway bridge. Expect several thousand flooded acres along the entire length of the East Fork to its confluence with the Angelina River.
22' -
Water approaches bottom of bridge decking. Several hundred acres flooded.
21' -
Expect several hundred flooded acres. Water approaches the bottom of the Farm to Market 225 highway bridge. Move livestock and equipment to higher ground.
19' -
Expect several dozen flooded acres. Move livestock and equipment to higher ground.
17' -
Expect flooding of several secondary roadways. Ranchers should move cattle and equipment to higher ground.
15' -
Minor lowland flooding.
| Date | Stage (ft) |
|---|---|
| May 19, 2019 | 17.79 |
| Apr 30, 2016 | 17.79 |
| Feb 20, 2020 | 17.18 |
| Mar 10, 2016 | 17.13 |
| May 21, 2021 | 16.35 |
| Nov 18, 2015 | 16.15 |
| Mar 29, 2018 | 15.82 |
| Dec 29, 2015 | 15.77 |
| Dec 28, 2015 | 15.23 |
| Apr 19, 2016 | 15.06 |
| Apr 20, 2016 | 15.03 |
| Dec 15, 2015 | 15 |
| Aug 11, 1988 | 14.24 |
| Apr 12, 1980 | 13.34 |
| May 16, 1989 | 12.58 |
| Jul 23, 1968 | 11.66 |
| Mar 30, 1965 | 11.48 |
| Jan 24, 1974 | 11.47 |
| Jun 2, 1979 | 11.23 |
| Mar 5, 1884 | 11.07 |
Data provided by the National Weather Service.