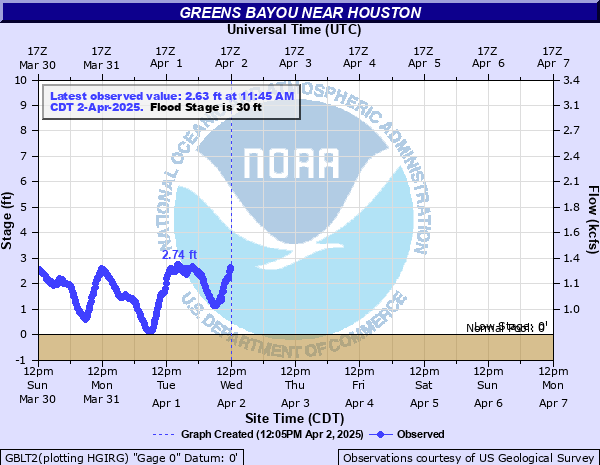
Greens Bayou near Houston
Critical Stages
27' - Action
30' - Flood
32' - Moderate
33' - Major
Latest Observation
Updated: 3:45 AM CST 12/15/25
Status: No Flooding
Stage: 0.52 ft
Flow: 0.879 kcfs
Forecast
Forecast not available for this location.
| Time | Stage (ft) | Flow (kcfs) |
|---|---|---|
| 4:45 AM 12/15 | 0.65 | 0.901 |
| 4:30 AM 12/15 | 0.53 | 0.88 |
| 4:15 AM 12/15 | 0.47 | 0.871 |
| 4:00 AM 12/15 | 0.5 | 0.875 |
| 3:45 AM 12/15 | 0.52 | 0.879 |
| 3:30 AM 12/15 | 0.56 | 0.886 |
| 3:15 AM 12/15 | 0.62 | 0.896 |
| 3:00 AM 12/15 | 0.68 | 0.906 |
| 2:45 AM 12/15 | 0.74 | 0.916 |
| 2:30 AM 12/15 | 0.83 | 0.931 |
| 2:15 AM 12/15 | 0.85 | 0.935 |
| 2:00 AM 12/15 | 0.83 | 0.931 |
| 1:45 AM 12/15 | 0.77 | 0.921 |
| 1:30 AM 12/15 | 0.82 | 0.93 |
| 1:15 AM 12/15 | 0.66 | 0.902 |
| 1:00 AM 12/15 | 0.68 | 0.906 |
| 12:45 AM 12/15 | 0.59 | 0.89 |
| 12:30 AM 12/15 | 0.61 | 0.894 |
| 12:15 AM 12/15 | 0.68 | 0.906 |
| 12:00 AM 12/15 | 0.75 | 0.918 |
| 11:45 PM 12/14 | 0.86 | 0.936 |
| 11:30 PM 12/14 | 0.95 | 0.952 |
| 11:15 PM 12/14 | 1.05 | 0.97 |
| 11:00 PM 12/14 | 1.13 | 0.984 |
| 10:45 PM 12/14 | 1.18 | 0.992 |
| 10:30 PM 12/14 | 1.23 | 1 |
| 10:15 PM 12/14 | 1.24 | 1 |
| 10:00 PM 12/14 | 1.2 | 0.996 |
| 9:45 PM 12/14 | 1.15 | 0.987 |
| 9:30 PM 12/14 | 1.05 | 0.97 |
33' -
Major lowland flooding begins in the vicinity of the gage.
32' -
Moderate lowland flooding begins at the gage.
30' -
Minor lowland flooding begins in the vicinity of the gage.
| Date | Stage (ft) |
|---|---|
| Aug 28, 2017 | 44.85 |
| Jun 9, 2001 | 44.02 |
| Jun 27, 1989 | 39.4 |
| May 18, 1989 | 36.75 |
| Oct 29, 2002 | 36.66 |
| Sep 15, 2008 | 36.24 |
| Oct 18, 1994 | 36.1 |
| Oct 16, 2006 | 35.17 |
| Jun 6, 2001 | 34.6 |
| Oct 31, 2015 | 34.28 |
| Jun 13, 1973 | 34.27 |
| Nov 18, 2003 | 34.19 |
| May 26, 2015 | 34.19 |
| May 25, 1997 | 34.15 |
| Jun 19, 2006 | 34.06 |
| Mar 4, 1992 | 33.9 |
| Sep 20, 2019 | 33.61 |
| Sep 20, 1979 | 33.61 |
| Sep 11, 1998 | 33.49 |
| Jul 3, 2010 | 32.8 |
Data provided by the National Weather Service.