James River near Stratford
Critical Stages
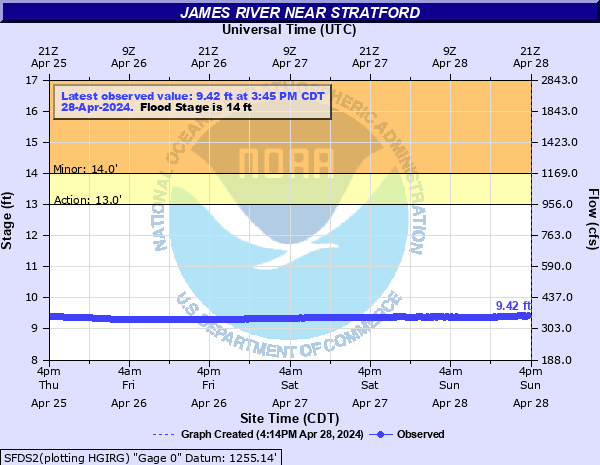
13' - Action
14' - Flood
17' - Moderate
18.5' - Major
Latest Observation
Updated: 3:45 AM CST 12/16/25
Status: No Flooding
Stage: 9.1 ft
Flow: 0.394 kcfs
Forecast
Forecast not available for this location.
| Time | Stage (ft) | Flow (kcfs) |
|---|---|---|
| 4:45 AM 12/16 | 9.1 | 0.394 |
| 4:30 AM 12/16 | 9.1 | 0.394 |
| 4:15 AM 12/16 | 9.1 | 0.394 |
| 4:00 AM 12/16 | 9.1 | 0.394 |
| 3:45 AM 12/16 | 9.1 | 0.394 |
| 3:30 AM 12/16 | 9.11 | 0.395 |
| 3:15 AM 12/16 | 9.11 | 0.395 |
| 3:00 AM 12/16 | 9.12 | 0.397 |
| 2:45 AM 12/16 | 9.12 | 0.397 |
| 2:30 AM 12/16 | 9.11 | 0.395 |
| 2:15 AM 12/16 | 9.11 | 0.395 |
| 2:00 AM 12/16 | 9.12 | 0.397 |
| 1:45 AM 12/16 | 9.12 | 0.397 |
| 1:30 AM 12/16 | 9.12 | 0.397 |
| 1:15 AM 12/16 | 9.12 | 0.397 |
| 1:00 AM 12/16 | 9.13 | 0.398 |
| 12:45 AM 12/16 | 9.13 | 0.398 |
| 12:30 AM 12/16 | 9.12 | 0.397 |
| 12:15 AM 12/16 | 9.13 | 0.398 |
| 12:00 AM 12/16 | 9.12 | 0.397 |
| 11:45 PM 12/15 | 9.13 | 0.398 |
| 11:30 PM 12/15 | 9.13 | 0.398 |
| 11:15 PM 12/15 | 9.13 | 0.398 |
| 11:00 PM 12/15 | 9.13 | 0.398 |
| 10:45 PM 12/15 | 9.13 | 0.398 |
| 10:30 PM 12/15 | 9.13 | 0.398 |
| 10:15 PM 12/15 | 9.14 | 0.399 |
| 10:00 PM 12/15 | 9.13 | 0.398 |
| 9:45 PM 12/15 | 9.14 | 0.399 |
| 9:30 PM 12/15 | 9.14 | 0.399 |
27' -
The bridge at the gauging location is overtopped.
25' -
The water reaches the bottom of the bridge at the gauging location.
22' -
The bridge 3 miles south of the gauge is overtopped.
20' -
142nd Street is flooded.
19.5' -
The bridge on 148th Street is under water.
19' -
The water reaches the bottom of the bridge 3 miles south of the gauge.
18.5' -
395th Avenue is flooded and the road and bridge on 146th Street is under water.
17.5' -
The water reaches the bottom of the bridge 2 miles north of the gauge.
17' -
County roads begin flooding and the road 2 miles north of the gauging location is one of the first to flood.
16' -
137th Street and 140th Street are flooded.
14' -
Significant amounts of agricultural lands begin flooding.
| Date | Stage (ft) |
|---|---|
| Jul 19, 2011 | 21.57 |
| Mar 29, 2010 | 20.08 |
| Apr 26, 2009 | 19.98 |
| May 18, 1995 | 19.86 |
| Apr 6, 1997 | 19.48 |
| Apr 19, 2019 | 18.68 |
| Apr 23, 2001 | 18.46 |
| Apr 18, 2020 | 18.43 |
| Apr 19, 1952 | 18.13 |
| Apr 24, 1969 | 18.1 |
| May 14, 1950 | 17.8 |
| May 19, 2023 | 17.8 |
| Jul 12, 2005 | 16.95 |
| Apr 10, 1966 | 16.75 |
| May 13, 1986 | 16.7 |
| Jul 28, 1975 | 16.5 |
| Jul 2, 1996 | 16.4 |
| Apr 14, 1987 | 16.2 |
| Apr 30, 1982 | 16 |
| Apr 13, 1989 | 15.9 |
Data provided by the National Weather Service.