« Back to Dolton Public Library District Rivers
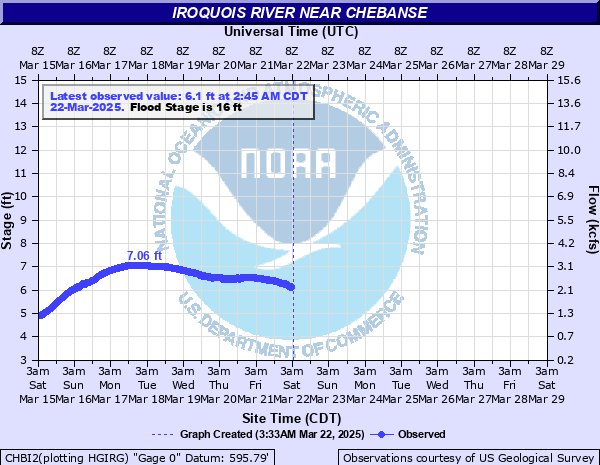
Iroquois River near Chebanse
Critical Stages
15' - Action
16' - Flood
18' - Moderate
20' - Major
Latest Observation
Updated: 3:45 PM CST 12/15/25
Status: No Flooding
Stage: 3.06 ft
Flow: 0.276 kcfs
Forecast
Forecast not available for this location.
| Time | Stage (ft) | Flow (kcfs) |
|---|---|---|
| 4:45 PM 12/15 | 3.06 | 0.276 |
| 4:30 PM 12/15 | 3.06 | 0.276 |
| 4:15 PM 12/15 | 3.06 | 0.276 |
| 4:00 PM 12/15 | 3.05 | 0.272 |
| 3:45 PM 12/15 | 3.06 | 0.276 |
| 3:30 PM 12/15 | 3.06 | 0.276 |
| 3:15 PM 12/15 | 3.05 | 0.272 |
| 3:00 PM 12/15 | 3.05 | 0.272 |
| 2:45 PM 12/15 | 3.05 | 0.272 |
| 2:30 PM 12/15 | 3.05 | 0.272 |
| 2:15 PM 12/15 | 3.06 | 0.276 |
| 2:00 PM 12/15 | 3.06 | 0.276 |
| 1:45 PM 12/15 | 3.07 | 0.279 |
| 1:30 PM 12/15 | 3.08 | 0.283 |
| 1:15 PM 12/15 | 3.08 | 0.283 |
| 1:00 PM 12/15 | 3.08 | 0.283 |
| 12:45 PM 12/15 | 3.08 | 0.283 |
| 12:30 PM 12/15 | 3.08 | 0.283 |
| 12:15 PM 12/15 | 3.08 | 0.283 |
| 12:00 PM 12/15 | 3.08 | 0.283 |
| 11:45 AM 12/15 | 3.1 | 0.29 |
| 11:30 AM 12/15 | 3.01 | 0.258 |
| 11:15 AM 12/15 | 2.8 | 0.191 |
| 11:00 AM 12/15 | 2.8 | 0.191 |
| 10:45 AM 12/15 | 2.78 | 0.185 |
| 10:30 AM 12/15 | 2.79 | 0.188 |
| 10:15 AM 12/15 | 2.81 | 0.194 |
| 10:00 AM 12/15 | 2.86 | 0.209 |
| 9:45 AM 12/15 | 2.9 | 0.222 |
| 9:30 AM 12/15 | 2.91 | 0.225 |
23' -
Water nears the top of the levees at Watseka wastewater facility.
22' -
Structures threatened at Sugar Island east of Chebanse.
21.5' -
Widespread inundation of hundreds of residential and commercial structures in Watseka. 7750S Road and Bridge Road threatened at Sugar Island east of Chebanse.
20' -
Widespread inundation of roadways and structures reaches multiple blocks from the river in Watseka. Residential structures threatened near the confluence of the Iroquois and Kankakee Rivers.
18' -
Multiple structures threatened in Watseka.
17.5' -
4000S Road, 174S Road, 2000E Road, and River Road threatened south of Aroma Park.
16' -
Agricultural land along the river is inundated.
13.5' -
174S Road threatened near 5000S Road northeast of Chebanse.
12.5' -
Water overflows low-lying banks near Watseka and Chebanse.
| Date | Stage (ft) |
|---|---|
| Mar 7, 1979 | 21.68 |
| Feb 23, 2018 | 20.6 |
| Jan 11, 2008 | 20.14 |
| May 20, 1943 | 19.68 |
| Feb 13, 1959 | 19.02 |
| Feb 24, 1982 | 18.96 |
| Jul 14, 2015 | 18.79 |
| Dec 31, 2015 | 18.7 |
| Jan 15, 2005 | 18.63 |
| May 15, 1970 | 18.6 |
| Oct 6, 1926 | 18.3 |
| Jan 1, 1991 | 18.22 |
| Jun 15, 1958 | 18.06 |
| Feb 25, 1985 | 17.76 |
| Mar 13, 1990 | 17.74 |
| Feb 4, 1968 | 17.7 |
| Feb 9, 1942 | 17.6 |
| Jul 15, 1957 | 17.53 |
| Mar 13, 2009 | 17.21 |
| Jun 23, 2015 | 17.13 |
Data provided by the National Weather Service.