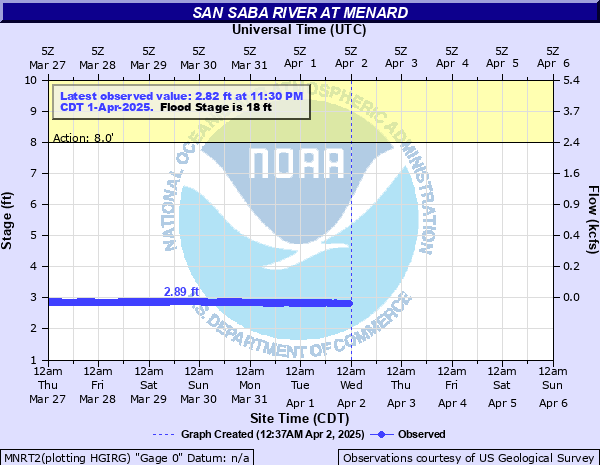
San Saba River at Menard
Critical Stages
8' - Action
18' - Flood
22' - Moderate
26' - Major
Latest Observation
Updated: 1:20 AM CST 12/10/25
Status: No Flooding
Stage: 2.99 ft
Flow: 0.0468 kcfs
Forecast
Forecast not available for this location.
| Time | Stage (ft) | Flow (kcfs) |
|---|---|---|
| 1:35 AM 12/10 | 2.98 | 0.0456 |
| 1:30 AM 12/10 | 2.98 | 0.0456 |
| 1:25 AM 12/10 | 2.98 | 0.0456 |
| 1:20 AM 12/10 | 2.99 | 0.0468 |
| 1:15 AM 12/10 | 2.99 | 0.0468 |
| 1:10 AM 12/10 | 2.99 | 0.0468 |
| 1:05 AM 12/10 | 2.98 | 0.0456 |
| 1:00 AM 12/10 | 2.98 | 0.0456 |
| 12:55 AM 12/10 | 2.98 | 0.0456 |
| 12:50 AM 12/10 | 2.98 | 0.0456 |
| 12:45 AM 12/10 | 2.99 | 0.0468 |
| 12:40 AM 12/10 | 2.99 | 0.0468 |
| 12:35 AM 12/10 | 2.99 | 0.0468 |
| 12:30 AM 12/10 | 2.98 | 0.0456 |
| 12:25 AM 12/10 | 2.98 | 0.0456 |
| 12:20 AM 12/10 | 2.98 | 0.0456 |
| 12:15 AM 12/10 | 2.99 | 0.0468 |
| 12:10 AM 12/10 | 2.99 | 0.0468 |
| 12:05 AM 12/10 | 2.99 | 0.0468 |
| 12:00 AM 12/10 | 2.98 | 0.0456 |
| 11:55 PM 12/9 | 2.98 | 0.0456 |
| 11:50 PM 12/9 | 2.98 | 0.0456 |
| 11:45 PM 12/9 | 2.99 | 0.0468 |
| 11:40 PM 12/9 | 2.99 | 0.0468 |
| 11:35 PM 12/9 | 2.98 | 0.0456 |
| 11:30 PM 12/9 | 2.98 | 0.0456 |
| 11:25 PM 12/9 | 2.99 | 0.0468 |
| 11:20 PM 12/9 | 2.98 | 0.0456 |
| 11:15 PM 12/9 | 2.98 | 0.0456 |
| 11:10 PM 12/9 | 2.98 | 0.0456 |
26' -
Major flooding will occur. Water will enter buildings adjacent to the river in the Menard Business District. Roads and low water crossings will be flooded. Water will begin to flow over Highway 83 bridge.
22' -
Moderate flooding will occur. Structures in the Menard Business District may become flooded along the river. Secondary roads and low water crossings will be flooded.
18' -
Minor flooding will occur. Water will begin to reach the Menard Business District. The city park will be flooded. Water will begin to encroach on the Menard County RV Park.
8' -
The Menard City Park will be inundated.
5' -
The Decker Street low water crossing just downstream of the gage will be flooded.
| Date | Stage (ft) |
|---|---|
| Jun 6, 1899 | 23.3 |
| Jul 23, 1938 | 22.2 |
| Sep 16, 1936 | 21.2 |
| Sep 8, 1980 | 21 |
| Sep 17, 1974 | 19.82 |
| Jul 15, 1990 | 19.72 |
| Sep 17, 1990 | 19.34 |
| Sep 26, 1946 | 18.7 |
| Aug 28, 1974 | 18.64 |
| Nov 3, 2000 | 18 |
| Oct 5, 1941 | 17.6 |
| May 1, 1956 | 17.54 |
| Aug 2, 1978 | 17.36 |
| Oct 13, 1973 | 17.22 |
| Jun 17, 1958 | 16.7 |
| Apr 19, 1957 | 15.97 |
| Oct 17, 1942 | 15.67 |
| Apr 15, 1977 | 14.74 |
| Oct 4, 1953 | 14.52 |
| Aug 5, 1990 | 14.49 |
Data provided by the National Weather Service.