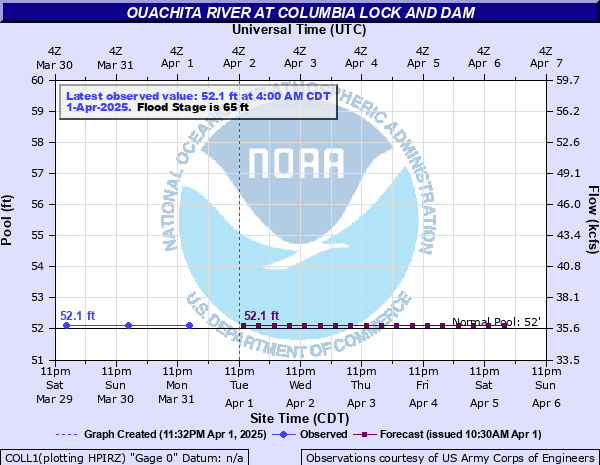
Ouachita River at Columbia Lock and Dam
Critical Stages
62' - Action
65' - Flood
67' - Moderate
70' - Major
Latest Observation
Updated: 5:00 AM CST 12/13/25
Status: No Flooding
Stage: 49.1 ft
Flow: 28.8 kcfs
Forecast
| Time | Stage (ft) | Flow (kcfs) |
|---|---|---|
| 12 PM 12/13 | 49.1 | 28.8 |
| 6 PM 12/13 | 49.1 | 28.8 |
| 12 AM 12/14 | 49.1 | 28.8 |
| 6 AM 12/14 | 49.1 | 28.8 |
| 12 PM 12/14 | 49.1 | 28.8 |
| 6 PM 12/14 | 49.1 | 28.8 |
| 12 AM 12/15 | 49.1 | 28.8 |
| 6 AM 12/15 | 49.1 | 28.8 |
| 12 PM 12/15 | 49.1 | 28.8 |
| 6 PM 12/15 | 49.1 | 28.8 |
| 12 AM 12/16 | 49.1 | 28.8 |
| 6 AM 12/16 | 49.1 | 28.8 |
| 12 PM 12/16 | 49.1 | 28.8 |
| 6 PM 12/16 | 49.1 | 28.8 |
| 12 AM 12/17 | 49.1 | 28.8 |
| 6 AM 12/17 | 49.1 | 28.8 |
| Time | Stage (ft) | Flow (kcfs) |
|---|---|---|
| 5:00 AM 12/13 | 49.1 | 28.8 |
| 5:00 AM 12/12 | 49.1 | 28.8 |
| 5:00 AM 12/11 | 49 | 28.6 |
| 4:00 AM 12/10 | 49 | 28.6 |
| 4:00 AM 12/9 | 49 | 28.6 |
| 4:00 AM 12/8 | 49 | 28.6 |
| 5:00 AM 12/7 | 49.1 | 28.8 |
| 4:00 AM 12/6 | 49.1 | 28.8 |
| 5:00 AM 12/5 | 49.1 | 28.8 |
| 5:00 AM 12/4 | 49.1 | 28.8 |
| 5:00 AM 12/3 | 49.1 | 28.8 |
| 5:00 AM 12/2 | 49.1 | 28.8 |
| 5:00 AM 12/1 | 49.1 | 28.8 |
| 4:00 AM 11/30 | 49.1 | 28.8 |
| 5:00 AM 11/29 | 49.2 | 29.1 |
| 5:00 AM 11/28 | 49.1 | 28.8 |
| 4:00 AM 11/27 | 49 | 28.6 |
| 4:00 AM 11/26 | 49 | 28.6 |
| 4:00 AM 11/25 | 49.2 | 29.1 |
| 4:00 AM 11/24 | 49 | 28.6 |
| 4:00 AM 11/23 | 49.1 | 28.8 |
| 4:00 AM 11/22 | 49 | 28.6 |
| 4:00 AM 11/21 | 49 | 28.6 |
| 4:00 AM 11/20 | 49 | 28.6 |
| 4:00 AM 11/18 | 49 | 28.6 |
| 4:00 AM 11/17 | 49.1 | 28.8 |
| 4:00 AM 11/16 | 49.2 | 29.1 |
| 5:00 AM 11/15 | 49.1 | 28.8 |
| 4:00 AM 11/14 | 49.1 | 28.8 |
75' -
Thousands of acres of land flood between and near the levees. Some topping of levees may possible downstream from Columbia.
70' -
Lowland flooding will continue to slowly recede, but the river will remain above flood stage for several more days.
67' -
The Columbia Lock and Dam recreational area floods and must be closed. In addition, expect moderate to severe flooding of lowland river bottoms between and near levee systems.
65' -
The riverton recreational area floods and must be closed. In addition, expect minor flooding of lowland river bottoms.
| Date | Stage (ft) |
|---|---|
| May 5, 1991 | 72.37 |
| May 13, 1973 | 70.65 |
| Nov 12, 2009 | 69.3 |
| Jan 9, 1983 | 69.1 |
| Mar 18, 2018 | 68.9 |
| Mar 28, 2016 | 68.4 |
| Mar 19, 2001 | 68.3 |
| May 24, 2019 | 68.2 |
| Dec 31, 1982 | 67.7 |
| May 13, 1979 | 67.4 |
| May 17, 1975 | 67.1 |
| Feb 2, 1974 | 67 |
| May 30, 2009 | 65.3 |
| Apr 8, 1990 | 64.67 |
| Apr 18, 1989 | 62.9 |
| Feb 2, 1988 | 61.2 |
| Apr 25, 1980 | 60.5 |
| Mar 16, 1994 | 60.3 |
| Mar 12, 1984 | 58 |
| Apr 1, 1987 | 57.2 |
Data provided by the National Weather Service.