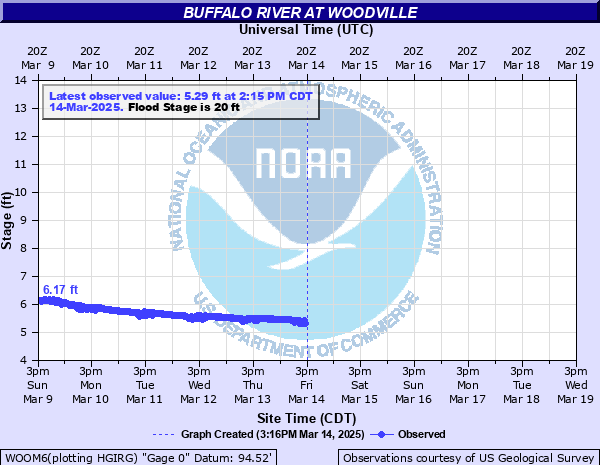
Buffalo River at Woodville
Critical Stages
19' - Action
20' - Flood
30' - Moderate
50' - Major
Latest Observation
Updated: 5:15 AM CST 12/13/25
Status: No Flooding
Stage: 3.85 ft
Flow: 0.048 kcfs
Forecast
Forecast not available for this location.
| Time | Stage (ft) | Flow (kcfs) |
|---|---|---|
| 5:15 AM 12/13 | 3.85 | 0.048 |
| 5:00 AM 12/13 | 3.85 | 0.048 |
| 4:45 AM 12/13 | 3.85 | 0.048 |
| 4:30 AM 12/13 | 3.85 | 0.048 |
| 4:15 AM 12/13 | 3.85 | 0.048 |
| 4:00 AM 12/13 | 3.85 | 0.048 |
| 3:45 AM 12/13 | 3.85 | 0.048 |
| 3:30 AM 12/13 | 3.85 | 0.048 |
| 3:15 AM 12/13 | 3.85 | 0.048 |
| 3:00 AM 12/13 | 3.85 | 0.048 |
| 2:45 AM 12/13 | 3.85 | 0.048 |
| 2:30 AM 12/13 | 3.85 | 0.048 |
| 2:15 AM 12/13 | 3.85 | 0.048 |
| 2:00 AM 12/13 | 3.85 | 0.048 |
| 1:45 AM 12/13 | 3.85 | 0.048 |
| 1:30 AM 12/13 | 3.85 | 0.048 |
| 1:15 AM 12/13 | 3.85 | 0.048 |
| 1:00 AM 12/13 | 3.84 | 0.046 |
| 12:45 AM 12/13 | 3.84 | 0.046 |
| 12:30 AM 12/13 | 3.84 | 0.046 |
| 12:15 AM 12/13 | 3.85 | 0.048 |
| 12:00 AM 12/13 | 3.85 | 0.048 |
| 11:45 PM 12/12 | 3.85 | 0.048 |
| 11:30 PM 12/12 | 3.85 | 0.048 |
| 11:15 PM 12/12 | 3.85 | 0.048 |
| 11:00 PM 12/12 | 3.84 | 0.046 |
| 10:45 PM 12/12 | 3.85 | 0.048 |
| 10:30 PM 12/12 | 3.85 | 0.048 |
| 10:15 PM 12/12 | 3.84 | 0.046 |
| 10:00 PM 12/12 | 3.85 | 0.048 |
25.53' -
Flood of Record occurred on August 12, 2016. Widespread damage will occur across the area, with approximately 70 homes endangered at Centreville and Woodville. Fosters Creek may respond around Crosby. Roads will be inundated., particularly over the western third of the county. Large parts of western Wilkinson County will be flooded.
25' -
Widespread flooding will develop around Centreville. Low-lying areas will be inundated with many homes damaged. Dozens of roads will be under water. Localized flooding may occur around Crosby.
22' -
Widespread flooding will spread into a few homes close to the river. Several roads will be inundated.
20' -
Flooding will begin over low-lying areas close to the river.
| Date | Stage (ft) |
|---|---|
| Aug 12, 2016 | 25.79 |
| Mar 25, 1973 | 22.3 |
| Apr 22, 1979 | 22.02 |
| Jan 25, 1990 | 21.27 |
| May 12, 2021 | 20.61 |
| Mar 28, 2014 | 20.45 |
| Oct 4, 1964 | 20.19 |
| Apr 5, 1983 | 19.95 |
| Jan 10, 2013 | 19.92 |
| Apr 15, 1967 | 19.88 |
| Mar 5, 1992 | 19.67 |
| Jan 30, 1999 | 19.67 |
| Apr 13, 1974 | 19.61 |
| Jul 19, 1969 | 19.56 |
| Dec 6, 1971 | 19.39 |
| Jul 7, 2001 | 19.35 |
| Nov 29, 1977 | 19.24 |
| Jun 8, 1975 | 19.12 |
| Jan 27, 1994 | 19.05 |
| Mar 30, 2017 | 19.04 |
Data provided by the National Weather Service.