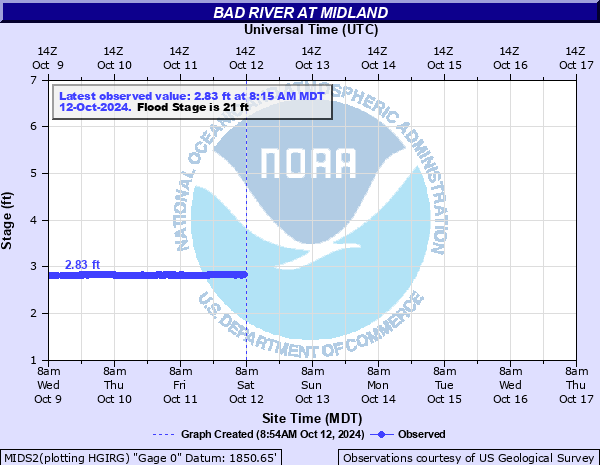
Bad River (SD) near Midland
Critical Stages
19' - Action
21' - Flood
24' - Moderate
25' - Major
Latest Observation
Updated: 5:15 AM MST 12/17/25
Status: No Flooding
Stage: 5.22 ft
Flow: 0.186 kcfs
Forecast
Forecast not available for this location.
| Time | Stage (ft) | Flow (kcfs) |
|---|---|---|
| 5:15 AM 12/17 | 5.22 | 0.186 |
| 5:00 AM 12/17 | 5.16 | 0.176 |
| 4:45 AM 12/17 | 4.95 | 0.143 |
| 4:30 AM 12/17 | 4.51 | 0.0961 |
| 4:15 AM 12/17 | 4.49 | 0.0938 |
| 4:00 AM 12/17 | 4.11 | 0.0446 |
| 3:45 AM 12/17 | 4.1 | 0.0438 |
| 3:30 AM 12/17 | 3.76 | 0.0181 |
| 3:15 AM 12/17 | 3.62 | 0.0127 |
| 3:00 AM 12/17 | 3.49 | 0.0069 |
| 2:45 AM 12/17 | 3.41 | 0.0061 |
| 2:30 AM 12/17 | 3.34 | 0.0054 |
| 2:15 AM 12/17 | 3.34 | 0.0054 |
| 2:00 AM 12/17 | 3.31 | 0.0051 |
| 1:45 AM 12/17 | 3.24 | 0.0037 |
| 1:30 AM 12/17 | 3.35 | 0.0055 |
| 1:15 AM 12/17 | 3.28 | 0.0045 |
| 1:00 AM 12/17 | 3.28 | 0.0045 |
| 12:45 AM 12/17 | 3.23 | 0.0035 |
| 12:30 AM 12/17 | 3.27 | 0.0043 |
| 12:15 AM 12/17 | 3.25 | 0.0039 |
| 12:00 AM 12/17 | 3.25 | 0.0039 |
| 11:45 PM 12/16 | 3.25 | 0.0039 |
| 11:30 PM 12/16 | 3.2 | 0.003 |
| 11:15 PM 12/16 | 3.17 | 0.0027 |
| 11:00 PM 12/16 | 3.1 | 0.002 |
| 10:45 PM 12/16 | 3.1 | 0.002 |
| 10:30 PM 12/16 | 3.1 | 0.002 |
| 10:15 PM 12/16 | 3.16 | 0.0025 |
| 10:00 PM 12/16 | 3.14 | 0.0024 |
25' -
Major flood stage. Extensive flooding along the Bad River with inundation of structures and roads.
24' -
Moderate flood stage. Some inundation of structures and roads near the river are possible.
22' -
Flooding of agricultural land on both sides of the Bad River.
21' -
Minor Flood stage. Flooding of agricultural land begins along the south bank.
19' -
Action Stage. Flooding of low lying areas along the Bad River.
15.5' -
Lowland flooding begins along the north bank of the Bad River.
| Date | Stage (ft) |
|---|---|
| Jun 15, 1967 | 24.44 |
| May 30, 1991 | 23.74 |
| May 23, 2019 | 23.48 |
| Feb 19, 1997 | 23.25 |
| May 29, 1996 | 22.99 |
| Jun 7, 1999 | 22.63 |
| Mar 20, 1978 | 22.49 |
| Mar 4, 1994 | 21.34 |
| May 21, 1982 | 20.31 |
| Jun 25, 2011 | 19.69 |
| Jun 7, 2008 | 19.67 |
| Apr 19, 1986 | 18.81 |
| May 2, 1983 | 17.95 |
| Aug 27, 1998 | 17.54 |
| Jun 10, 1995 | 17.4 |
| Feb 10, 2009 | 17.26 |
| Mar 21, 1987 | 17.1 |
| May 28, 1996 | 16.71 |
| May 24, 2020 | 16.07 |
| Jun 8, 1991 | 15.91 |
Data provided by the National Weather Service.