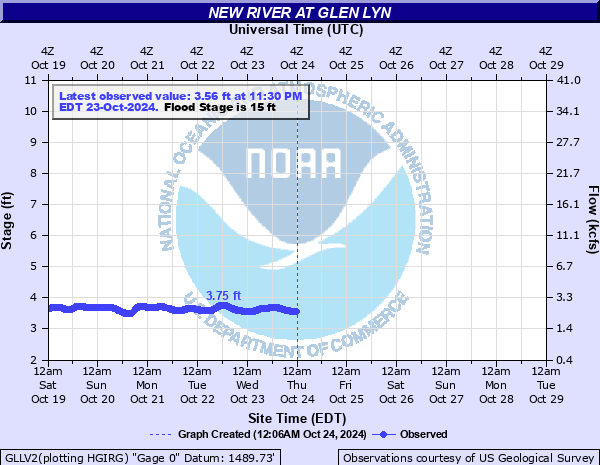
New River at Glen Lyn
Critical Stages
12' - Action
15' - Flood
16' - Moderate
18' - Major
Latest Observation
Updated: 1:30 AM EST 12/11/25
Status: No Flooding
Stage: 3.32 ft
Flow: 2.11 kcfs
Forecast
Forecast not available for this location.
| Time | Stage (ft) | Flow (kcfs) |
|---|---|---|
| 1:30 AM 12/11 | 3.32 | 2.11 |
| 1:15 AM 12/11 | 3.32 | 2.11 |
| 1:00 AM 12/11 | 3.32 | 2.11 |
| 12:45 AM 12/11 | 3.32 | 2.11 |
| 12:30 AM 12/11 | 3.32 | 2.11 |
| 12:15 AM 12/11 | 3.32 | 2.11 |
| 12:00 AM 12/11 | 3.32 | 2.11 |
| 11:45 PM 12/10 | 3.31 | 2.1 |
| 11:30 PM 12/10 | 3.31 | 2.1 |
| 11:15 PM 12/10 | 3.31 | 2.1 |
| 11:00 PM 12/10 | 3.3 | 2.08 |
| 10:45 PM 12/10 | 3.3 | 2.08 |
| 10:30 PM 12/10 | 3.29 | 2.06 |
| 10:15 PM 12/10 | 3.29 | 2.06 |
| 10:00 PM 12/10 | 3.29 | 2.06 |
| 9:45 PM 12/10 | 3.28 | 2.04 |
| 9:30 PM 12/10 | 3.28 | 2.04 |
| 9:15 PM 12/10 | 3.28 | 2.04 |
| 9:00 PM 12/10 | 3.28 | 2.04 |
| 8:45 PM 12/10 | 3.27 | 2.03 |
| 8:30 PM 12/10 | 3.27 | 2.03 |
| 8:15 PM 12/10 | 3.27 | 2.03 |
| 8:00 PM 12/10 | 3.27 | 2.03 |
| 7:45 PM 12/10 | 3.28 | 2.04 |
| 7:30 PM 12/10 | 3.28 | 2.04 |
| 7:15 PM 12/10 | 3.28 | 2.04 |
| 7:00 PM 12/10 | 3.28 | 2.04 |
| 6:45 PM 12/10 | 3.29 | 2.06 |
| 6:30 PM 12/10 | 3.29 | 2.06 |
| 6:15 PM 12/10 | 3.3 | 2.08 |
18' -
Significant flooding of trailer campgrounds along the New River. Flooding on Caboose Lane in Pembroke and Jason's Circle in Narrows.
17' -
Some campgrounds along the river are affected.
15' -
Low spots along route 649 (Lurich road) upstream from the gage are flooded.
12' -
Flooding of Lurich road near Narrows begins, possibly by Wolf Creek.
11' -
Flooding begins in low parts of Glen Lyn Landing State Park.
10' -
Water begins covering Ripplemead Road near Whitt-Riverbend Park in Ripplemead.
9.5' -
Portions of the Lurich Road Campground begin to flood.
9' -
Portions of Eggleston River Road near the community of Eggleston will become inundated with water.
| Date | Stage (ft) |
|---|---|
| Aug 14, 1940 | 27.5 |
| Sep 28, 2024 | 24.33 |
| Jan 16, 1995 | 19.83 |
| Oct 12, 2018 | 19.47 |
| Oct 26, 1918 | 19 |
| May 22, 2020 | 18.93 |
| Nov 7, 1977 | 18.12 |
| Feb 1, 2013 | 18.07 |
| Jan 19, 1996 | 18.01 |
| Sep 23, 1989 | 17.71 |
| Mar 24, 1993 | 17.47 |
| Jun 5, 1992 | 17.47 |
| Nov 20, 2003 | 17.4 |
| Jun 22, 1972 | 17.36 |
| Apr 5, 1977 | 17.16 |
| May 29, 1973 | 16.69 |
| Apr 25, 1987 | 15.97 |
| Feb 23, 2003 | 15.71 |
| Apr 25, 2017 | 15.65 |
| Nov 13, 2020 | 15.39 |
Data provided by the National Weather Service.