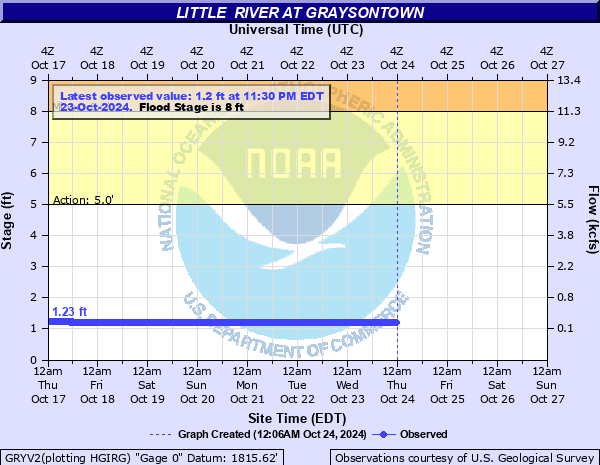
Little River at Graysontown
Critical Stages
5' - Action
8' - Flood
10' - Moderate
12' - Major
Latest Observation
Updated: 1:30 AM EST 12/11/25
Status: No Flooding
Stage: 1.21 ft
Flow: 0.128 kcfs
Forecast
Forecast not available for this location.
| Time | Stage (ft) | Flow (kcfs) |
|---|---|---|
| 2:30 AM 12/11 | 1.21 | 0.128 |
| 2:15 AM 12/11 | 1.21 | 0.128 |
| 2:00 AM 12/11 | 1.21 | 0.128 |
| 1:45 AM 12/11 | 1.21 | 0.128 |
| 1:30 AM 12/11 | 1.21 | 0.128 |
| 1:15 AM 12/11 | 1.21 | 0.128 |
| 1:00 AM 12/11 | 1.21 | 0.128 |
| 12:45 AM 12/11 | 1.2 | 0.125 |
| 12:30 AM 12/11 | 1.2 | 0.125 |
| 12:15 AM 12/11 | 1.2 | 0.125 |
| 12:00 AM 12/11 | 1.2 | 0.125 |
| 11:45 PM 12/10 | 1.2 | 0.125 |
| 11:30 PM 12/10 | 1.2 | 0.125 |
| 11:15 PM 12/10 | 1.2 | 0.125 |
| 11:00 PM 12/10 | 1.2 | 0.125 |
| 10:45 PM 12/10 | 1.21 | 0.128 |
| 10:30 PM 12/10 | 1.21 | 0.128 |
| 10:15 PM 12/10 | 1.21 | 0.128 |
| 10:00 PM 12/10 | 1.21 | 0.128 |
| 9:45 PM 12/10 | 1.21 | 0.128 |
| 9:30 PM 12/10 | 1.21 | 0.128 |
| 9:15 PM 12/10 | 1.21 | 0.128 |
| 9:00 PM 12/10 | 1.21 | 0.128 |
| 8:45 PM 12/10 | 1.21 | 0.128 |
| 8:30 PM 12/10 | 1.21 | 0.128 |
| 8:15 PM 12/10 | 1.21 | 0.128 |
| 8:00 PM 12/10 | 1.21 | 0.128 |
| 7:45 PM 12/10 | 1.21 | 0.128 |
| 7:30 PM 12/10 | 1.21 | 0.128 |
| 7:15 PM 12/10 | 1.21 | 0.128 |
12' -
Water begins to approach Graysontown Road (Route 693) on the right bank just before the bridge at the gage house.
11' -
Blue Spring Road is flooded.
10' -
Agricultural and lowland flooding fairly extensive upstream from gage between Blue Springs Road and Indian Valley Road.
8' -
Minor lowland flooding begins.
| Date | Stage (ft) |
|---|---|
| Jun 21, 1972 | 13.4 |
| Oct 2, 1929 | 12.84 |
| Sep 30, 1959 | 12.76 |
| Sep 30, 2015 | 12.68 |
| Nov 5, 1985 | 11.67 |
| Oct 19, 1937 | 11.55 |
| Oct 17, 1932 | 11.44 |
| Sep 28, 2004 | 11.36 |
| Dec 1, 1934 | 11.04 |
| Aug 19, 1939 | 10.67 |
| Sep 22, 1989 | 10.49 |
| Dec 8, 1950 | 10.4 |
| Jan 26, 1978 | 10.33 |
| Apr 22, 1992 | 10.07 |
| Oct 17, 1936 | 9.92 |
| Oct 12, 2018 | 9.57 |
| Apr 10, 1983 | 9.39 |
| Sep 22, 1979 | 8.78 |
| Jun 18, 2020 | 8.66 |
| Nov 12, 2020 | 8.55 |
Data provided by the National Weather Service.