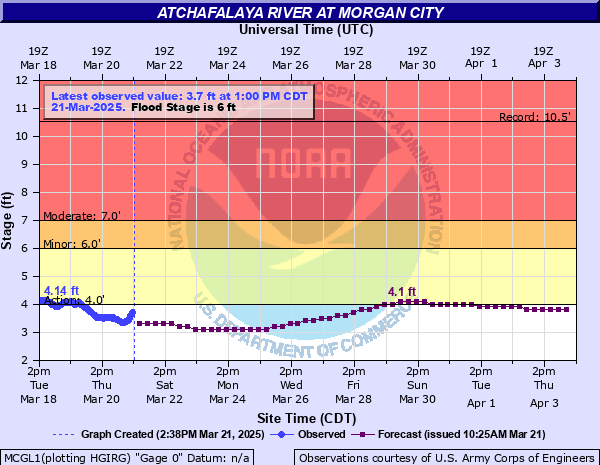
Atchafalaya River at Morgan City
Critical Stages
4' - Action
6' - Flood
7' - Moderate
12' - Major
Latest Observation
Updated: 12:00 PM CST 12/5/25
Status: No Flooding
Stage: 1.28 ft
Flow: 79 kcfs
Forecast
| Time | Stage (ft) | Flow (kcfs) |
|---|---|---|
| 6 PM 12/5 | 2.4 | 97.7 |
| 12 AM 12/6 | 3 | 114 |
| 6 AM 12/6 | 2.5 | 100 |
| 12 PM 12/6 | 1.7 | 84 |
| 6 PM 12/6 | 2.5 | 100 |
| 12 AM 12/7 | 3 | 114 |
| 6 AM 12/7 | 2.5 | 100 |
| 12 PM 12/7 | 1.8 | 85.4 |
| 6 PM 12/7 | 2.5 | 100 |
| 12 AM 12/8 | 3 | 114 |
| 6 AM 12/8 | 2.5 | 100 |
| 12 PM 12/8 | 1.8 | 85.4 |
| 6 PM 12/8 | 2.5 | 100 |
| 12 AM 12/9 | 3 | 114 |
| 6 AM 12/9 | 2.5 | 100 |
| 12 PM 12/9 | 1.8 | 85.4 |
| 6 PM 12/9 | 2.5 | 100 |
| 12 AM 12/10 | 3 | 114 |
| 6 AM 12/10 | 2.4 | 97.7 |
| 12 PM 12/10 | 1.7 | 84 |
| 6 PM 12/10 | 2.4 | 97.7 |
| 12 AM 12/11 | 2.9 | 111 |
| 6 AM 12/11 | 2.4 | 97.7 |
| 12 PM 12/11 | 1.8 | 85.4 |
| 6 PM 12/11 | 2.5 | 100 |
| 12 AM 12/12 | 3 | 114 |
| 6 AM 12/12 | 2.4 | 97.7 |
| 12 PM 12/12 | 1.7 | 84 |
| 6 PM 12/12 | 2.4 | 97.7 |
| 12 AM 12/13 | 2.9 | 111 |
| 6 AM 12/13 | 2.4 | 97.7 |
| 12 PM 12/13 | 1.8 | 85.4 |
| 6 PM 12/13 | 2.4 | 97.7 |
| 12 AM 12/14 | 2.9 | 111 |
| 6 AM 12/14 | 2.4 | 97.7 |
| 12 PM 12/14 | 1.7 | 84 |
| 6 PM 12/14 | 2.4 | 97.7 |
| 12 AM 12/15 | 2.9 | 111 |
| 6 AM 12/15 | 2.5 | 100 |
| 12 PM 12/15 | 2 | 88 |
| 6 PM 12/15 | 2.5 | 100 |
| 12 AM 12/16 | 2.9 | 111 |
| 6 AM 12/16 | 2.5 | 100 |
| 12 PM 12/16 | 2 | 88 |
| 6 PM 12/16 | 2.3 | 95.3 |
| 12 AM 12/17 | 2.7 | 104 |
| 6 AM 12/17 | 2.9 | 111 |
| 12 PM 12/17 | 2.4 | 97.7 |
| 6 PM 12/17 | 1.9 | 86.7 |
| 12 AM 12/18 | 2.4 | 97.7 |
| 6 AM 12/18 | 2.9 | 111 |
| 12 PM 12/18 | 2.5 | 100 |
| 6 PM 12/18 | 1.9 | 86.7 |
| 12 AM 12/19 | 2.5 | 100 |
| 6 AM 12/19 | 2.9 | 111 |
| Time | Stage (ft) | Flow (kcfs) |
|---|---|---|
| 12:00 PM 12/5 | 1.28 | 79 |
| 11:00 AM 12/5 | 1.38 | 79.9 |
| 10:00 AM 12/5 | 1.46 | 80.7 |
| 9:00 AM 12/5 | 1.59 | 82.4 |
| 8:00 AM 12/5 | 1.69 | 83.8 |
| 7:00 AM 12/5 | 1.82 | 85.6 |
| 6:00 AM 12/5 | 1.96 | 87.5 |
| 5:00 AM 12/5 | 2.08 | 90 |
| 4:00 AM 12/5 | 2.17 | 92.2 |
| 3:00 AM 12/5 | 2.23 | 93.7 |
| 2:00 AM 12/5 | 2.27 | 94.6 |
| 1:00 AM 12/5 | 2.35 | 96.5 |
| 12:00 AM 12/5 | 2.53 | 101 |
| 11:00 PM 12/4 | 2.72 | 105 |
| 10:00 PM 12/4 | 2.97 | 113 |
| 9:00 PM 12/4 | 3.05 | 116 |
| 8:00 PM 12/4 | 3.15 | 121 |
| 7:00 PM 12/4 | 3.21 | 124 |
| 6:00 PM 12/4 | 3.08 | 118 |
| 5:00 PM 12/4 | 2.68 | 104 |
| 4:00 PM 12/4 | 2.12 | 91 |
| 3:00 PM 12/4 | 1.67 | 83.5 |
| 2:00 PM 12/4 | 1.48 | 80.8 |
| 1:00 PM 12/4 | 1.44 | 80.5 |
| 12:00 PM 12/4 | 1.42 | 80.3 |
| 11:00 AM 12/4 | 1.47 | 80.7 |
| 10:00 AM 12/4 | 1.56 | 81.9 |
| 9:00 AM 12/4 | 1.59 | 82.4 |
| 8:00 AM 12/4 | 1.7 | 84 |
| 7:00 AM 12/4 | 1.75 | 84.7 |
20' -
There is a catastrophic flood threat. Evacuation of the cities of Berwick and Morgan City is strongly recommended. Flood walls protect the cities to an elevation of 21 feet.
12' -
There is a major flood threat. Back water flooding of Bayou Bouef will cause damage east of Morgan City to the community of Amelia. Structures on the river side of protection walls in Morgan City and Berwick will be under water. River traffic restrictions will be strictly enforced.
9' -
Structures on the river side of protection walls in Morgan City and Berwick will be under water. River traffic restrictions will be strictly enforced.
7' -
Buildings at the foot of Ann Street on the river side of the flood wall will flood as water overtops the Rio Oil Company dock. Buildings on the river side of the Berwick floodwall will flood. River traffic restrictions will be strictly enforced. In addition, backwater flooding could potentially impact portions areas around Lake Palourde and Stephensville.
6' -
Flood stage. The city dock will be under water. Water will cover the lower end of Belleview Front Street in Berwick. Vessel traffic will be affected by stronger river current and vessel traffic safety rules will be strictly enforced by the U.S. Coast Guard.
5' -
Floodwall gates will be closed to protect against higher stages. Vessel traffic will be affected by stronger river current and vessel traffic safety rules will be strictly enforced by the U.S. Coast Guard.
4' -
Action stage. Water will move up the bank and across access roads below the city dock. Floodwall gates should be closed by the 5 foot stage to protect against higher stages. Vessel traffic will be affected by stronger river current and vessel traffic safety rules will be strictly enforced by the U.S. Coast Guard.
| Date | Stage (ft) |
|---|---|
| May 28, 1973 | 10.53 |
| May 29, 2011 | 10.35 |
| Jul 13, 2019 | 10.06 |
| Jun 27, 1957 | 8.46 |
| Mar 15, 2019 | 8.29 |
| Jan 22, 2016 | 8.2 |
| Apr 5, 1997 | 8.06 |
| Apr 18, 1975 | 7.95 |
| Apr 13, 2020 | 7.93 |
| Apr 5, 1997 | 7.72 |
| Jun 6, 1983 | 7.32 |
| Jun 3, 2017 | 7.18 |
| Jun 4, 2009 | 7.13 |
| Mar 30, 2018 | 7.12 |
| Apr 16, 1976 | 7 |
| Apr 14, 2021 | 6.99 |
| May 4, 1979 | 6.99 |
| May 7, 2025 | 6.91 |
| Oct 3, 2002 | 6.9 |
| Feb 8, 2005 | 6.88 |
Data provided by the National Weather Service.