Leon River near Belton
Critical Stages
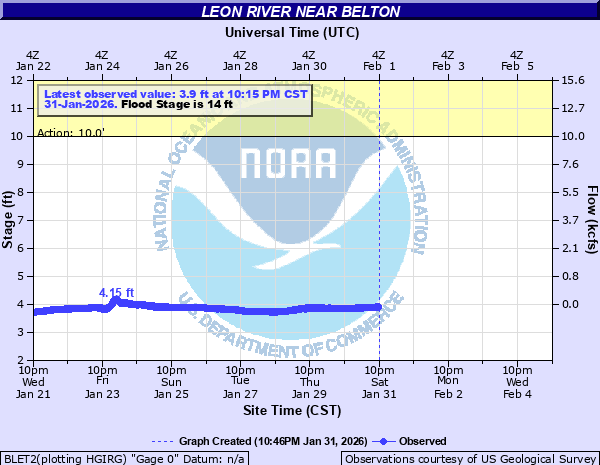
10' - Action
14' - Flood
16' - Moderate
20' - Major
Latest Observation
Updated: 11:15 AM CST 12/11/25
Status: No Flooding
Stage: 3.85 ft
Flow: 0.0202 kcfs
Forecast
Forecast not available for this location.
| Time | Stage (ft) | Flow (kcfs) |
|---|---|---|
| 11:15 AM 12/11 | 3.85 | 0.0202 |
| 11:00 AM 12/11 | 3.85 | 0.0202 |
| 10:45 AM 12/11 | 3.85 | 0.0202 |
| 10:30 AM 12/11 | 3.85 | 0.0202 |
| 10:15 AM 12/11 | 3.84 | 0.019 |
| 10:00 AM 12/11 | 3.84 | 0.019 |
| 9:45 AM 12/11 | 3.84 | 0.019 |
| 9:30 AM 12/11 | 3.84 | 0.019 |
| 9:15 AM 12/11 | 3.83 | 0.0179 |
| 9:00 AM 12/11 | 3.83 | 0.0179 |
| 8:45 AM 12/11 | 3.84 | 0.019 |
| 8:30 AM 12/11 | 3.84 | 0.019 |
| 8:15 AM 12/11 | 3.83 | 0.0179 |
| 8:00 AM 12/11 | 3.84 | 0.019 |
| 7:45 AM 12/11 | 3.83 | 0.0179 |
| 7:30 AM 12/11 | 3.83 | 0.0179 |
| 7:15 AM 12/11 | 3.84 | 0.019 |
| 7:00 AM 12/11 | 3.83 | 0.0179 |
| 6:45 AM 12/11 | 3.83 | 0.0179 |
| 6:30 AM 12/11 | 3.83 | 0.0179 |
| 6:15 AM 12/11 | 3.83 | 0.0179 |
| 6:00 AM 12/11 | 3.83 | 0.0179 |
| 5:45 AM 12/11 | 3.82 | 0.0169 |
| 5:30 AM 12/11 | 3.83 | 0.0179 |
| 5:15 AM 12/11 | 3.82 | 0.0169 |
| 5:00 AM 12/11 | 3.83 | 0.0179 |
| 4:45 AM 12/11 | 3.83 | 0.0179 |
| 4:30 AM 12/11 | 3.82 | 0.0169 |
| 4:15 AM 12/11 | 3.83 | 0.0179 |
| 4:00 AM 12/11 | 3.82 | 0.0169 |
30' -
Water will rise well into the recreation park, over the running trail, and into the soccer and baseball fields. The city water pumping plant will flood.
23' -
Water will rise into the water recreation park, the city park, and approach the soccer and baseball fields.
20' -
Major flooding will occur in the city park and the water amusement park.
16' -
Moderate flooding will occur along right bank of river. Water will get into the water amusement park, and the city park on right bank.
14' -
Minor flooding will occur in the city park. Water will begin to flood the water amusement park downstream from the gage.
12' -
Water will be slightly out of the low banks.
| Date | Stage (ft) |
|---|---|
| Dec 1, 1913 | 25 |
| Apr 22, 1945 | 24.41 |
| May 26, 1944 | 22.22 |
| Sep 1, 1921 | 21 |
| Sep 28, 1936 | 20 |
| May 18, 1935 | 17.08 |
| Apr 25, 1942 | 16.58 |
| Mar 13, 1946 | 15.95 |
| Oct 6, 1930 | 15.35 |
| Oct 2, 1927 | 15.05 |
| Jul 24, 1938 | 14.65 |
| Nov 25, 1940 | 14.16 |
| Oct 22, 1959 | 9.42 |
| Jun 19, 1957 | 9.12 |
| Jul 3, 2016 | 8.54 |
| Jun 27, 2015 | 8.5 |
| May 8, 1956 | 8.39 |
| Jun 5, 1965 | 8.31 |
| Oct 22, 1957 | 8.15 |
| Jan 9, 1975 | 8.02 |
Data provided by the National Weather Service.