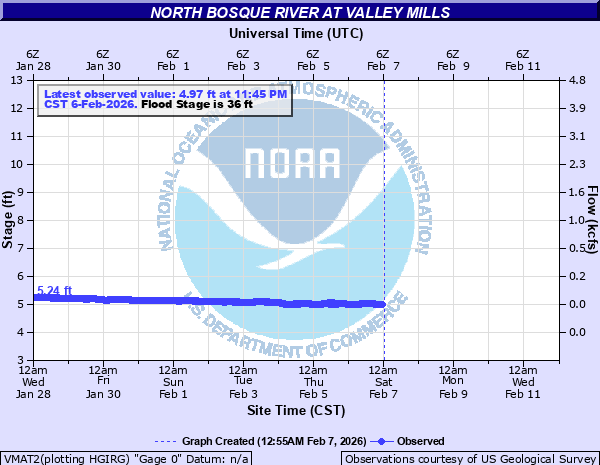
North Bosque River at Valley Mills
Critical Stages
34' - Action
36' - Flood
39' - Moderate
44' - Major
Latest Observation
Updated: 10:45 AM CST 12/11/25
Status: No Flooding
Stage: 4.96 ft
Flow: 0.0168 kcfs
Forecast
Forecast not available for this location.
| Time | Stage (ft) | Flow (kcfs) |
|---|---|---|
| 10:45 AM 12/11 | 4.96 | 0.0168 |
| 10:30 AM 12/11 | 4.96 | 0.0168 |
| 10:15 AM 12/11 | 4.96 | 0.0168 |
| 10:00 AM 12/11 | 4.96 | 0.0168 |
| 9:45 AM 12/11 | 4.96 | 0.0168 |
| 9:30 AM 12/11 | 4.95 | 0.0163 |
| 9:15 AM 12/11 | 4.95 | 0.0163 |
| 9:00 AM 12/11 | 4.96 | 0.0168 |
| 8:45 AM 12/11 | 4.95 | 0.0163 |
| 8:30 AM 12/11 | 4.95 | 0.0163 |
| 8:15 AM 12/11 | 4.95 | 0.0163 |
| 8:00 AM 12/11 | 4.95 | 0.0163 |
| 7:45 AM 12/11 | 4.95 | 0.0163 |
| 7:30 AM 12/11 | 4.95 | 0.0163 |
| 7:15 AM 12/11 | 4.95 | 0.0163 |
| 7:00 AM 12/11 | 4.95 | 0.0163 |
| 6:45 AM 12/11 | 4.95 | 0.0163 |
| 6:30 AM 12/11 | 4.95 | 0.0163 |
| 6:15 AM 12/11 | 4.95 | 0.0163 |
| 6:00 AM 12/11 | 4.95 | 0.0163 |
| 5:45 AM 12/11 | 4.95 | 0.0163 |
| 5:30 AM 12/11 | 4.94 | 0.0158 |
| 5:15 AM 12/11 | 4.94 | 0.0158 |
| 5:00 AM 12/11 | 4.94 | 0.0158 |
| 4:45 AM 12/11 | 4.95 | 0.0163 |
| 4:30 AM 12/11 | 4.94 | 0.0158 |
| 4:15 AM 12/11 | 4.94 | 0.0158 |
| 4:00 AM 12/11 | 4.94 | 0.0158 |
| 3:45 AM 12/11 | 4.94 | 0.0158 |
| 3:30 AM 12/11 | 4.94 | 0.0158 |
44' -
Major flooding will occur along the river. The approach ramps to the bridge will be well underwater.
39' -
Moderate out of bank flow is expected along the river. The approach ramps to the bridge will flood.
36' -
Minor out of bank flow is expected. Caution should be exercised because the right approach ramp to the bridge will begin to flood.
| Date | Stage (ft) |
|---|---|
| Dec 21, 1991 | 44.6 |
| May 1, 1908 | 43.00446 |
| May 5, 2024 | 41.81 |
| Oct 4, 1959 | 40.22 |
| Mar 16, 1998 | 39.4 |
| Apr 26, 1990 | 39.1 |
| Jun 27, 2007 | 38.83 |
| Oct 10, 1961 | 38.82 |
| Jun 16, 1981 | 38.26 |
| Oct 29, 2023 | 38.01 |
| Sep 1, 1936 | 38 |
| Apr 1, 1945 | 38 |
| May 16, 1965 | 38 |
| Jun 29, 2007 | 37.28 |
| Sep 5, 2007 | 37.25 |
| Jan 29, 2010 | 36.98 |
| May 1, 1977 | 36.88 |
| Apr 16, 1977 | 36.78 |
| Oct 20, 1971 | 36.67 |
| Oct 16, 2018 | 36.29 |
Data provided by the National Weather Service.