« Back to Eagle Hills Golf Course Rivers
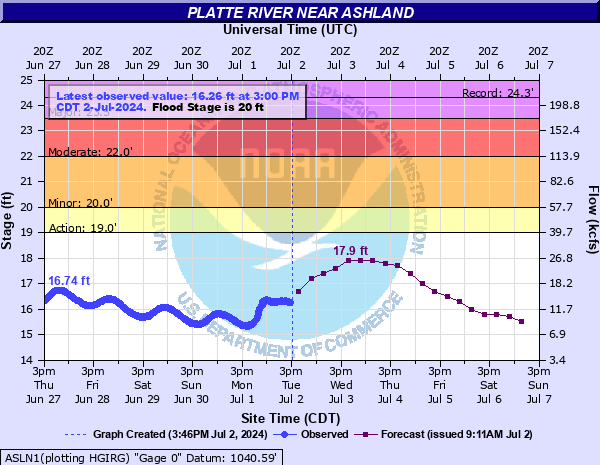
Platte River near Ashland
Critical Stages
19' - Action
20' - Flood
22' - Moderate
23.5' - Major
Latest Observation
Updated: 11:00 PM CST 12/14/25
Status: No Flooding
Stage: 14.71 ft
Flow: 5.45 kcfs
Forecast
Forecast not available for this location.
| Time | Stage (ft) | Flow (kcfs) |
|---|---|---|
| 12:00 AM 12/15 | 14.62 | 5.15 |
| 11:45 PM 12/14 | 14.64 | 5.22 |
| 11:30 PM 12/14 | 14.66 | 5.28 |
| 11:15 PM 12/14 | 14.69 | 5.38 |
| 11:00 PM 12/14 | 14.71 | 5.45 |
| 10:45 PM 12/14 | 14.72 | 5.48 |
| 10:30 PM 12/14 | 14.71 | 5.45 |
| 10:15 PM 12/14 | 14.74 | 5.54 |
| 10:00 PM 12/14 | 14.77 | 5.64 |
| 9:45 PM 12/14 | 14.77 | 5.64 |
| 9:30 PM 12/14 | 14.76 | 5.61 |
| 9:15 PM 12/14 | 14.78 | 5.67 |
| 9:00 PM 12/14 | 14.79 | 5.71 |
| 8:45 PM 12/14 | 14.8 | 5.74 |
| 8:30 PM 12/14 | 14.81 | 5.77 |
| 8:15 PM 12/14 | 14.83 | 5.84 |
| 8:00 PM 12/14 | 14.84 | 5.87 |
| 7:45 PM 12/14 | 14.84 | 5.87 |
| 7:30 PM 12/14 | 14.83 | 5.84 |
| 7:15 PM 12/14 | 14.85 | 5.9 |
| 7:00 PM 12/14 | 14.84 | 5.87 |
| 6:45 PM 12/14 | 14.88 | 6 |
| 6:30 PM 12/14 | 14.87 | 5.97 |
| 6:15 PM 12/14 | 14.88 | 6 |
| 6:00 PM 12/14 | 14.91 | 6.1 |
| 5:45 PM 12/14 | 14.9 | 6.07 |
| 5:30 PM 12/14 | 14.9 | 6.07 |
| 5:15 PM 12/14 | 14.92 | 6.13 |
| 5:00 PM 12/14 | 14.92 | 6.13 |
| 4:45 PM 12/14 | 14.93 | 6.16 |
27.5' -
Major flooding is in progress and water nears the bottom of the Highway 6 bridge.
22' -
Floodwaters will begin to impact the Linoma Beach area along the Sarpy County side.
21.5' -
The river begins to spread out for quite a distance from both banks with respect to flooding conditions. Flooding is widespread along and across the reach.
20' -
The river is at bankfull and overflows begin onto farmlands on both sides of the gage.
| Date | Stage (ft) |
|---|---|
| Mar 16, 2019 | 24.32 |
| Feb 20, 1997 | 23.05 |
| Feb 17, 2011 | 21.98 |
| Jul 25, 1993 | 21.45 |
| Mar 15, 2001 | 21.39 |
| Feb 23, 2007 | 21.22 |
| May 31, 2008 | 21.06 |
| Jun 15, 2010 | 20.95 |
| Feb 21, 1997 | 20.86 |
| Feb 21, 1996 | 20.49 |
| May 29, 1995 | 19.95 |
| Jun 17, 1990 | 19.85 |
| Jun 27, 2018 | 19.8 |
| Jun 23, 2024 | 19.75 |
| Feb 22, 2003 | 19.65 |
| Jun 28, 1999 | 19.6 |
| Jun 24, 1998 | 19.48 |
| Jun 19, 2016 | 19.35 |
| Jun 21, 2014 | 19.29 |
| Mar 10, 1993 | 19.23 |
Data provided by the National Weather Service.