« Back to Eagle Hills Golf Course Rivers
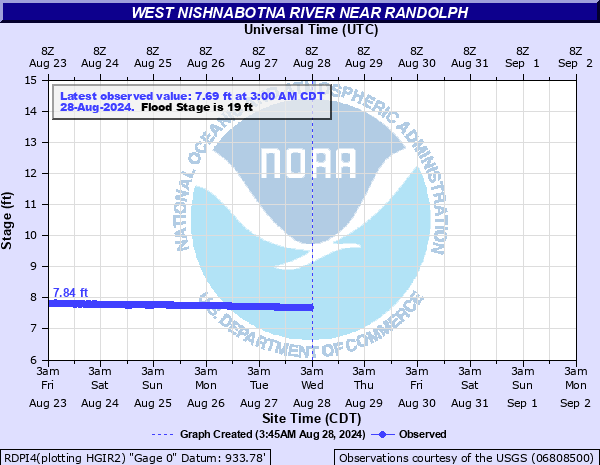
West Nishnabotna River near Randolph
Critical Stages
17' - Action
19' - Flood
22' - Moderate
27' - Major
Latest Observation
Updated: 12:00 AM CST 12/15/25
Status: No Flooding
Stage: 8.65 ft
Flow: 0.635 kcfs
Forecast
Forecast not available for this location.
| Time | Stage (ft) | Flow (kcfs) |
|---|---|---|
| 12:00 AM 12/15 | 8.65 | 0.635 |
| 11:45 PM 12/14 | 8.65 | 0.635 |
| 11:30 PM 12/14 | 8.64 | 0.63 |
| 11:15 PM 12/14 | 8.64 | 0.63 |
| 11:00 PM 12/14 | 8.64 | 0.63 |
| 10:45 PM 12/14 | 8.64 | 0.63 |
| 10:30 PM 12/14 | 8.65 | 0.635 |
| 10:15 PM 12/14 | 8.63 | 0.625 |
| 10:00 PM 12/14 | 8.63 | 0.625 |
| 9:45 PM 12/14 | 8.63 | 0.625 |
| 9:30 PM 12/14 | 8.62 | 0.62 |
| 9:15 PM 12/14 | 8.62 | 0.62 |
| 9:00 PM 12/14 | 8.61 | 0.616 |
| 8:45 PM 12/14 | 8.62 | 0.62 |
| 8:30 PM 12/14 | 8.61 | 0.616 |
| 8:15 PM 12/14 | 8.61 | 0.616 |
| 8:00 PM 12/14 | 8.61 | 0.616 |
| 7:45 PM 12/14 | 8.61 | 0.616 |
| 7:30 PM 12/14 | 8.61 | 0.616 |
| 7:15 PM 12/14 | 8.6 | 0.611 |
| 7:00 PM 12/14 | 8.6 | 0.611 |
| 6:45 PM 12/14 | 8.6 | 0.611 |
| 6:30 PM 12/14 | 8.6 | 0.611 |
| 6:15 PM 12/14 | 8.59 | 0.606 |
| 6:00 PM 12/14 | 8.59 | 0.606 |
| 5:45 PM 12/14 | 8.58 | 0.601 |
| 5:30 PM 12/14 | 8.57 | 0.596 |
| 5:15 PM 12/14 | 8.57 | 0.596 |
| 5:00 PM 12/14 | 8.56 | 0.591 |
| 4:45 PM 12/14 | 8.55 | 0.587 |
32' -
Flooding begins along the outskirts of Randolph.
28.5' -
Water begins to impact the bottom of the bridge at the gage site.
27' -
The road around the cemetery begins to flood on the west side. The town of Randolph is likely not impacted yet.
23' -
County road J18 (120th Street) west of Randolph begins to flood.
22' -
County Road L-68 located 5 miles south of Randolph begins to flood.
19' -
Rural agricultural lands begin to flood.
| Date | Stage (ft) |
|---|---|
| Mar 14, 2019 | 24.87 |
| Mar 5, 1949 | 24.6 |
| May 26, 1987 | 24.5 |
| May 7, 2007 | 24.16 |
| Jun 24, 1947 | 24 |
| Jun 15, 1998 | 23.92 |
| Jun 12, 2008 | 23.84 |
| Jul 23, 1993 | 23.6 |
| Jul 26, 1990 | 23.55 |
| Jun 15, 1982 | 23.51 |
| Aug 8, 1999 | 23.36 |
| Sep 9, 1989 | 22.92 |
| Mar 1, 1965 | 22.76 |
| Jun 21, 1967 | 22.6 |
| Jun 15, 1984 | 22.35 |
| Jun 4, 2014 | 22.08 |
| May 9, 1950 | 21.93 |
| Jul 3, 1951 | 21.77 |
| Sep 14, 1972 | 21.71 |
| Jun 2, 1951 | 21.66 |
Data provided by the National Weather Service.