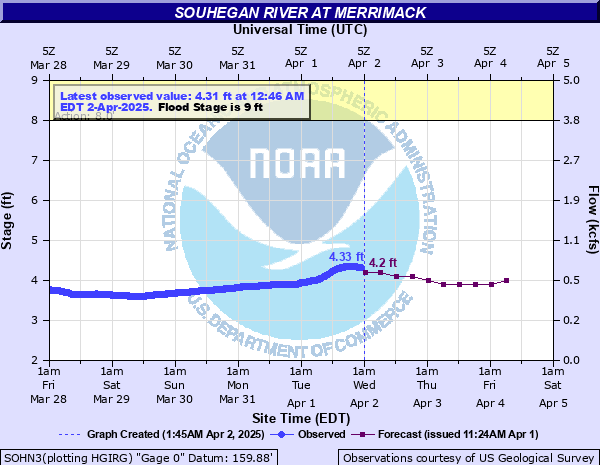
Souhegan River at Merrimack
Critical Stages
8' - Action
9' - Flood
11' - Moderate
13' - Major
Latest Observation
Updated: 10:30 PM EST 12/5/25
Status: No Flooding
Stage: 2.58 ft
Flow: 0.0763 kcfs
Forecast
| Time | Stage (ft) | Flow (kcfs) |
|---|---|---|
| 1 AM 12/6 | 2.5 | 0.063 |
| 7 AM 12/6 | 2.5 | 0.063 |
| 1 PM 12/6 | 2.5 | 0.063 |
| 7 PM 12/6 | 2.5 | 0.063 |
| 1 AM 12/7 | 2.5 | 0.063 |
| 7 AM 12/7 | 2.5 | 0.063 |
| 1 PM 12/7 | 2.5 | 0.063 |
| 7 PM 12/7 | 2.5 | 0.063 |
| 1 AM 12/8 | 2.5 | 0.063 |
| 7 AM 12/8 | 2.5 | 0.063 |
| Time | Stage (ft) | Flow (kcfs) |
|---|---|---|
| 10:30 PM 12/5 | 2.58 | 0.0763 |
| 10:15 PM 12/5 | 2.58 | 0.0763 |
| 10:00 PM 12/5 | 2.58 | 0.0763 |
| 9:45 PM 12/5 | 2.58 | 0.0763 |
| 9:30 PM 12/5 | 2.58 | 0.0763 |
| 9:15 PM 12/5 | 2.58 | 0.0763 |
| 9:00 PM 12/5 | 2.58 | 0.0763 |
| 8:45 PM 12/5 | 2.57 | 0.0745 |
| 8:30 PM 12/5 | 2.57 | 0.0745 |
| 8:15 PM 12/5 | 2.57 | 0.0745 |
| 8:00 PM 12/5 | 2.57 | 0.0745 |
| 7:45 PM 12/5 | 2.57 | 0.0745 |
| 7:30 PM 12/5 | 2.57 | 0.0745 |
| 7:15 PM 12/5 | 2.57 | 0.0745 |
| 7:00 PM 12/5 | 2.57 | 0.0745 |
| 6:46 PM 12/5 | 2.56 | 0.0728 |
| 6:45 PM 12/5 | 2.56 | 0.0728 |
| 6:30 PM 12/5 | 2.56 | 0.0728 |
| 6:15 PM 12/5 | 2.56 | 0.0728 |
| 6:00 PM 12/5 | 2.55 | 0.0711 |
| 5:45 PM 12/5 | 2.55 | 0.0711 |
| 5:30 PM 12/5 | 2.55 | 0.0711 |
| 5:15 PM 12/5 | 2.54 | 0.0694 |
| 5:00 PM 12/5 | 2.54 | 0.0694 |
| 4:45 PM 12/5 | 2.53 | 0.0677 |
| 4:30 PM 12/5 | 2.53 | 0.0677 |
| 4:15 PM 12/5 | 2.52 | 0.0661 |
| 4:00 PM 12/5 | 2.52 | 0.0661 |
| 3:45 PM 12/5 | 2.51 | 0.0646 |
| 3:30 PM 12/5 | 2.5 | 0.063 |
13' -
Significant flooding affects homes in the area of Beacon Drive in Merrimack. Other low lying sections upstream into Amherst and Milford experience flooding.
11' -
In Merrimack, homes in the Beacon Drive area flood. Other low lying areas upstream into Amherst and Milford flood.
10' -
In Merrimack, several homes along a small portion of Beacon Drive begin to flood. In Amherst, low lying areas begin to flood.
9' -
Flooding of low lying areas along the river begins in the town of Merrimack.
| Date | Stage (ft) |
|---|---|
| Mar 19, 1936 | 16.2 |
| Sep 21, 1938 | 12.78 |
| Apr 17, 2007 | 12.71 |
| Apr 8, 1924 | 11.82 |
| Jun 25, 1944 | 10.88 |
| Apr 13, 1934 | 10.66 |
| Mar 13, 1936 | 10.6 |
| Oct 16, 1955 | 10.3 |
| Apr 7, 1987 | 10.25 |
| Jan 10, 1956 | 10 |
| Oct 22, 1996 | 9.96 |
| Nov 14, 1937 | 9.92 |
| May 15, 2006 | 9.88 |
| Mar 15, 2010 | 9.85 |
| Apr 2, 2004 | 9.84 |
| Nov 5, 1927 | 9.73 |
| Aug 5, 1915 | 9.6 |
| Mar 31, 2010 | 9.19 |
| Dec 15, 1920 | 9.18 |
| Nov 29, 1937 | 9.01 |
Data provided by the National Weather Service.