Mississippi River at Wabasha - Pool 4
Critical Stages
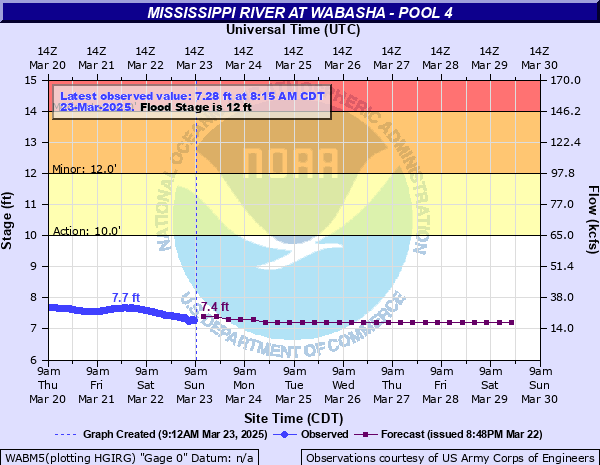
10' - Action
12' - Flood
14' - Moderate
16' - Major
Latest Observation
Updated: 3:15 PM CST 12/8/25
Status: No Flooding
Stage: 7.07 ft
Flow: 15.9 kcfs
Forecast
Forecast not available for this location.
| Time | Stage (ft) | Flow (kcfs) |
|---|---|---|
| 3:15 PM 12/8 | 7.07 | 15.9 |
| 3:00 PM 12/8 | 7.07 | 15.9 |
| 2:45 PM 12/8 | 7.08 | 16.2 |
| 2:30 PM 12/8 | 7.08 | 16.2 |
| 2:15 PM 12/8 | 7.08 | 16.2 |
| 2:00 PM 12/8 | 7.09 | 16.5 |
| 1:45 PM 12/8 | 7.09 | 16.5 |
| 1:30 PM 12/8 | 7.09 | 16.5 |
| 1:15 PM 12/8 | 7.1 | 16.8 |
| 1:00 PM 12/8 | 7.11 | 17.1 |
| 12:45 PM 12/8 | 7.11 | 17.1 |
| 12:30 PM 12/8 | 7.11 | 17.1 |
| 12:15 PM 12/8 | 7.12 | 17.4 |
| 12:00 PM 12/8 | 7.12 | 17.4 |
| 11:45 AM 12/8 | 7.13 | 17.7 |
| 11:30 AM 12/8 | 7.13 | 17.7 |
| 11:15 AM 12/8 | 7.14 | 18 |
| 11:00 AM 12/8 | 7.14 | 18 |
| 10:45 AM 12/8 | 7.14 | 18 |
| 10:30 AM 12/8 | 7.15 | 18.3 |
| 10:15 AM 12/8 | 7.15 | 18.3 |
| 10:00 AM 12/8 | 7.16 | 18.6 |
| 9:45 AM 12/8 | 7.16 | 18.6 |
| 9:30 AM 12/8 | 7.17 | 19 |
| 9:15 AM 12/8 | 7.17 | 19 |
| 9:00 AM 12/8 | 7.17 | 19 |
| 8:45 AM 12/8 | 7.18 | 19.3 |
| 8:30 AM 12/8 | 7.18 | 19.3 |
| 8:15 AM 12/8 | 7.19 | 19.7 |
| 8:00 AM 12/8 | 7.2 | 20 |
20.05' -
The water reaches the flood of record set in 1965.
20' -
The Dairyland Power Cooperative steam generation plant becomes inoperative.
18' -
Highway 30 and Hiawatha Drive will go under water.
16.5' -
The railroad goes out of operation.
15.3' -
Grant Boulevard between Maiden Avenue and Bridge Avenue is closed.
15' -
Lock and Dam 4 goes out of operation and damages may begin to occur in Alma Wisconsin.
14.4' -
Flooding begins near East Main Street.
14' -
Wisconsin Highway 35 between Maiden Rock and Stockholm may experience flooding.
13.5' -
Water begins to go over highway 60. Flooding also impacts the lower level of slippery's restaurant.
13' -
The railroad underpass on Highway 60 may be flooded. Flooding is also possible along Lawrence Boulevard and Main Street East. Some businesses near the river may be flooded.
12.5' -
Flooding occurs in the field west of the grocery store on Hiawatha Drive.
12' -
The river affects low lying areas.
| Date | Stage (ft) |
|---|---|
| Apr 19, 1965 | 20.05 |
| Apr 16, 2001 | 18.22 |
| Apr 16, 1969 | 17.63 |
| Apr 25, 2023 | 17.03 |
| Apr 18, 1952 | 16.71 |
| Apr 11, 1997 | 16.53 |
| Apr 16, 1951 | 16.4 |
| Apr 2, 2019 | 15.54 |
| Apr 5, 1967 | 15.46 |
| Jun 25, 1993 | 15.3 |
| May 6, 1954 | 15.22 |
| Apr 6, 1986 | 15.2 |
| Jun 30, 2024 | 15.18 |
| May 1, 1975 | 14.93 |
| Apr 14, 2011 | 14.89 |
| Jun 30, 2014 | 14.37 |
| Jun 20, 1943 | 14.2 |
| Apr 24, 1996 | 14 |
| May 24, 2019 | 13.89 |
| Sep 27, 1986 | 13.62 |
Data provided by the National Weather Service.