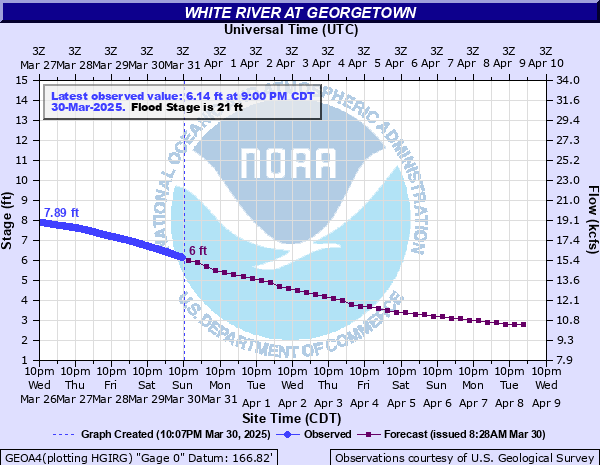
White River at Georgetown
Critical Stages
20.5' - Action
21' - Flood
24' - Moderate
28' - Major
Latest Observation
Updated: 8:00 PM CST 12/9/25
Status: No Flooding
Stage: 3.05 ft
Flow: 10.9 kcfs
Forecast
| Time | Stage (ft) | Flow (kcfs) |
|---|---|---|
| 12 AM 12/10 | 2.6 | 10.2 |
| 6 AM 12/10 | 2.4 | 9.94 |
| 12 PM 12/10 | 2.2 | 9.62 |
| 6 PM 12/10 | 2.1 | 9.46 |
| 12 AM 12/11 | 2 | 9.29 |
| 6 AM 12/11 | 2 | 9.29 |
| 12 PM 12/11 | 2 | 9.29 |
| 6 PM 12/11 | 2 | 9.29 |
| 12 AM 12/12 | 2 | 9.29 |
| 6 AM 12/12 | 1.9 | 9.15 |
| 12 PM 12/12 | 1.8 | 9.02 |
| 6 PM 12/12 | 1.7 | 8.9 |
| 12 AM 12/13 | 1.6 | 8.77 |
| 6 AM 12/13 | 1.5 | 8.63 |
| 12 PM 12/13 | 1.4 | 8.48 |
| 6 PM 12/13 | 1.3 | 8.33 |
| 12 AM 12/14 | 1.3 | 8.33 |
| 6 AM 12/14 | 1.2 | 8.16 |
| 12 PM 12/14 | 1.2 | 8.16 |
| 6 PM 12/14 | 1.2 | 8.16 |
| 12 AM 12/15 | 1.1 | 8.03 |
| 6 AM 12/15 | 1 | 7.94 |
| 12 PM 12/15 | 1 | 7.94 |
| 6 PM 12/15 | 1 | 7.94 |
| 12 AM 12/16 | 0.9 | 7.84 |
| 6 AM 12/16 | 0.9 | 7.84 |
| 12 PM 12/16 | 0.9 | 7.84 |
| 6 PM 12/16 | 0.9 | 7.84 |
| 12 AM 12/17 | 0.8 | 7.73 |
| 6 AM 12/17 | 0.8 | 7.73 |
| 12 PM 12/17 | 0.8 | 7.73 |
| 6 PM 12/17 | 0.8 | 7.73 |
| 12 AM 12/18 | 0.8 | 7.73 |
| 6 AM 12/18 | 0.7 | 7.61 |
| 12 PM 12/18 | 0.7 | 7.61 |
| 6 PM 12/18 | 0.7 | 7.61 |
| 12 AM 12/19 | 0.7 | 7.61 |
| 6 AM 12/19 | 0.7 | 7.61 |
| Time | Stage (ft) | Flow (kcfs) |
|---|---|---|
| 8:00 PM 12/9 | 3.05 | 10.9 |
| 7:45 PM 12/9 | 3.05 | 10.9 |
| 7:30 PM 12/9 | 3.06 | 10.9 |
| 7:15 PM 12/9 | 3.06 | 10.9 |
| 7:00 PM 12/9 | 3.07 | 10.9 |
| 6:45 PM 12/9 | 3.09 | 10.9 |
| 6:30 PM 12/9 | 3.09 | 10.9 |
| 6:15 PM 12/9 | 3.1 | 10.9 |
| 6:00 PM 12/9 | 3.1 | 10.9 |
| 5:45 PM 12/9 | 3.11 | 11 |
| 5:30 PM 12/9 | 3.11 | 11 |
| 5:15 PM 12/9 | 3.12 | 11 |
| 5:00 PM 12/9 | 3.12 | 11 |
| 4:45 PM 12/9 | 3.13 | 11 |
| 4:30 PM 12/9 | 3.14 | 11 |
| 4:15 PM 12/9 | 3.15 | 11 |
| 4:00 PM 12/9 | 3.15 | 11 |
| 3:45 PM 12/9 | 3.16 | 11 |
| 3:30 PM 12/9 | 3.17 | 11 |
| 3:15 PM 12/9 | 3.17 | 11 |
| 3:00 PM 12/9 | 3.18 | 11 |
| 2:45 PM 12/9 | 3.18 | 11 |
| 2:30 PM 12/9 | 3.19 | 11.1 |
| 2:15 PM 12/9 | 3.19 | 11.1 |
| 2:00 PM 12/9 | 3.2 | 11.1 |
| 1:45 PM 12/9 | 3.2 | 11.1 |
| 1:30 PM 12/9 | 3.21 | 11.1 |
| 1:15 PM 12/9 | 3.22 | 11.1 |
| 1:00 PM 12/9 | 3.22 | 11.1 |
| 12:45 PM 12/9 | 3.23 | 11.1 |
32' -
Overtopping of Kitty Barnes Levee in Woodruff and Prairie counties. Flood of record, was 33.95 feet May 2011.
30' -
Overtopping of both Little Red River Levees between 30 and 31 feet. Highest crest since completion of upstream reservoirs was 33.95 feet in May 2011, second highest was 30.2 feet in March 2008, third highest was 30.1 feet in April 1973. Georgetown is an island and persons in the community should leave or be prepared for a prolonged stay. Many homes and cabins are flooded along the lower reaches of the Little Red River and for several miles along State Highway 36 west of the White River in White County.
29' -
Patrolling begins on Kitty Barnes Levee in Woodruff County. Fifth highest crest since completion of upstream reservoirs. Serious conditions throughout White River Valley. River crested over 30 feet in May 2011, March and April 2008.
28' -
Levees along South Bank of Little Red River protecting cropland and the National Wildlife Refuge is possibly overtopped. Water runs around lower end of levee system. Homes flooded near Nimmo, near West Point, and in the Georgetown vicinity. Georgetown is isolated by floodwater. Residents should leave, or have provisions for a prolonged stay.
26' -
Backwater up Little Red River floods bottomland near West Point and Georgetown. Numerous roads and bridges flooded west of the river. Extensive area of cropland in White, Woodruff, and Prairie counties flooded. State Highway 36 is probably flooded and impassable. Georgetown and Nimmo could be isolated by floodwater. Residents should either leave or have provisions for a prolonged stay.
24' -
State Highway 36 to Georgetown may be flooding due to backwater up Little Red River, especially during locally heavy rainfall or high White River stage. Levee on north side of the Little Red River protecting the Bald Knob National Wildlife Refuge, primarily cropland, may be overtopped.
23' -
Minor street flooding in Georgetown including Heath Scott Drive and Riverside Street near the boat ramp.
22' -
Farm fields and farm roads on either side of Highway 36 west of Georgetown inundated.
21' -
Hurricane Lake Wildlife Management Area and Raft Creek Bottoms inundated. Roads in the bottoms are flooded.
| Date | Stage (ft) |
|---|---|
| May 6, 2011 | 33.95 |
| Feb 1, 1949 | 32.8 |
| Apr 4, 1945 | 32.1 |
| May 8, 2017 | 31.5 |
| Feb 23, 1938 | 31.5 |
| May 18, 1943 | 31.4 |
| Mar 18, 1935 | 31.3 |
| Apr 17, 1927 | 30.6 |
| Mar 24, 2008 | 30.18 |
| Apr 27, 1973 | 30.1 |
| Apr 15, 2008 | 30.05 |
| Dec 8, 1982 | 28.87 |
| Apr 11, 2025 | 28.31 |
| Jan 2, 2016 | 27.97 |
| Feb 20, 1989 | 26.2 |
| Apr 6, 1979 | 25.8 |
| Dec 27, 2009 | 24.31 |
| Apr 1, 2002 | 24.2 |
| Mar 3, 2018 | 24.01 |
| Jan 21, 2007 | 23.5 |
Data provided by the National Weather Service.