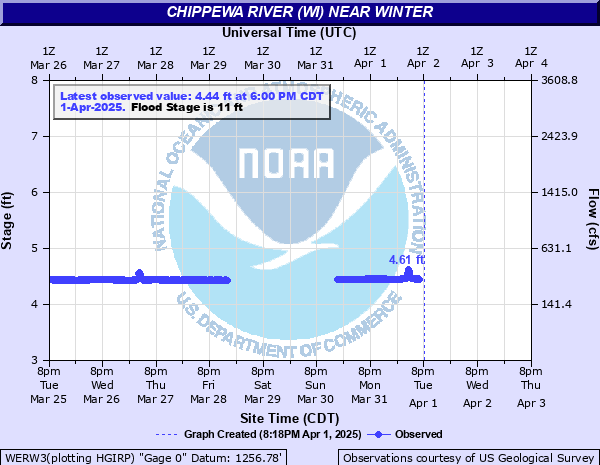
Chippewa River (WI) near Winter
Critical Stages
Action
11' - Flood
12' - Moderate
Major
Latest Observation
Updated: 2:00 PM CST 12/16/25
Status: No Flooding
Stage: 4.3 ft
Flow: 0.273 kcfs
Forecast
Forecast not available for this location.
| Time | Stage (ft) | Flow (kcfs) |
|---|---|---|
| 2:00 PM 12/16 | 4.3 | 0.273 |
| 1:45 PM 12/16 | 4.3 | 0.273 |
| 1:30 PM 12/16 | 4.3 | 0.273 |
| 1:15 PM 12/16 | 4.3 | 0.273 |
| 11:00 AM 12/16 | 4.3 | 0.273 |
| 10:45 AM 12/16 | 4.3 | 0.273 |
| 10:30 AM 12/16 | 4.3 | 0.273 |
| 10:15 AM 12/16 | 4.3 | 0.273 |
| 10:00 AM 12/16 | 4.3 | 0.273 |
| 9:45 AM 12/16 | 4.3 | 0.273 |
| 9:30 AM 12/16 | 4.3 | 0.273 |
| 9:15 AM 12/16 | 4.3 | 0.273 |
| 9:00 AM 12/16 | 4.3 | 0.273 |
| 8:45 AM 12/16 | 4.3 | 0.273 |
| 8:30 AM 12/16 | 4.3 | 0.273 |
| 8:15 AM 12/16 | 4.3 | 0.273 |
| 8:00 AM 12/16 | 4.3 | 0.273 |
| 7:45 AM 12/16 | 4.3 | 0.273 |
| 7:30 AM 12/16 | 4.3 | 0.273 |
| 7:15 AM 12/16 | 4.3 | 0.273 |
| 7:00 AM 12/16 | 4.3 | 0.273 |
| 6:45 AM 12/16 | 4.3 | 0.273 |
| 6:30 AM 12/16 | 4.3 | 0.273 |
| 6:15 AM 12/16 | 4.3 | 0.273 |
| 6:00 AM 12/16 | 4.3 | 0.273 |
| 5:45 AM 12/16 | 4.3 | 0.273 |
| 5:30 AM 12/16 | 4.3 | 0.273 |
| 5:15 AM 12/16 | 4.3 | 0.273 |
| 5:00 AM 12/16 | 4.3 | 0.273 |
| 4:45 AM 12/16 | 4.3 | 0.273 |
12' -
Water reaches base of gage house. Low Spots along State Hwy 40 near Exeland flood, County Hwy G (Bishops's Bridge) flooded and County Hwy G at Ojibwa flooded. Flooding at Litke Road (Town Line Rd), and Bloomberg Rd near Exeland
11' -
Minor flooding with water approaching dam road near the gage.
9.5' -
At this level river the flow is near 6000 cfs. Which triggers XCEL energy to employ the high water action plan.Structures near County Hwy G bridge (Bishop's Bridge) begin flooding.
8' -
Minor lowland flooding.
| Date | Stage (ft) |
|---|---|
| Sep 4, 1941 | 11.05 |
| Jun 29, 1946 | 10.7 |
| Apr 22, 2019 | 10.3 |
| May 4, 1954 | 10.25 |
| Apr 20, 2002 | 10.18 |
| May 11, 1950 | 10.07 |
| Apr 22, 2023 | 10.03 |
| Oct 9, 1985 | 9.98 |
| Apr 21, 2004 | 9.95 |
| Sep 15, 1994 | 9.83 |
| May 21, 2017 | 9.8 |
| Jun 18, 2018 | 9.72 |
| May 12, 2003 | 9.6 |
| Apr 29, 1996 | 9.31 |
| Apr 2, 1998 | 9.28 |
| Jul 27, 2020 | 9.14 |
| Jun 7, 2016 | 9.12 |
| May 13, 2014 | 9.07 |
| Jun 26, 2012 | 8.94 |
| May 5, 2013 | 8.81 |
Data provided by the National Weather Service.