North Canadian River near Harrah
Critical Stages
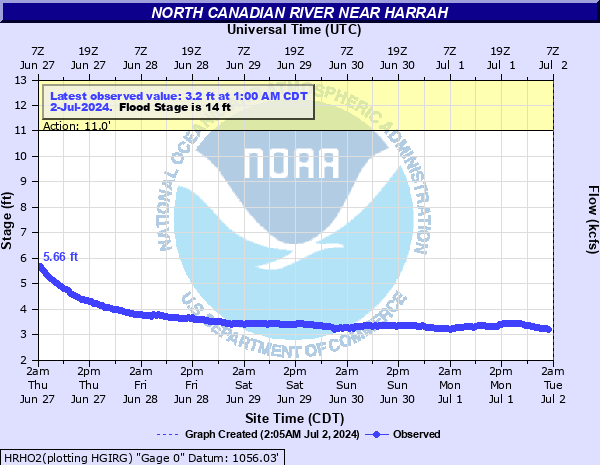
11' - Action
14' - Flood
16' - Moderate
18' - Major
Latest Observation
Updated: 4:15 AM CST 12/6/25
Status: No Flooding
Stage: 2.87 ft
Flow: 0.0889 kcfs
Forecast
Forecast not available for this location.
| Time | Stage (ft) | Flow (kcfs) |
|---|---|---|
| 4:15 AM 12/6 | 2.87 | 0.0889 |
| 4:00 AM 12/6 | 2.86 | 0.0873 |
| 3:45 AM 12/6 | 2.87 | 0.0889 |
| 3:30 AM 12/6 | 2.87 | 0.0889 |
| 3:15 AM 12/6 | 2.87 | 0.0889 |
| 3:00 AM 12/6 | 2.87 | 0.0889 |
| 2:45 AM 12/6 | 2.87 | 0.0889 |
| 2:30 AM 12/6 | 2.87 | 0.0889 |
| 2:15 AM 12/6 | 2.88 | 0.0906 |
| 2:00 AM 12/6 | 2.88 | 0.0906 |
| 1:45 AM 12/6 | 2.88 | 0.0906 |
| 1:30 AM 12/6 | 2.89 | 0.0922 |
| 1:15 AM 12/6 | 2.89 | 0.0922 |
| 1:00 AM 12/6 | 2.9 | 0.0939 |
| 12:45 AM 12/6 | 2.91 | 0.0956 |
| 12:30 AM 12/6 | 2.91 | 0.0956 |
| 12:15 AM 12/6 | 2.92 | 0.0974 |
| 12:00 AM 12/6 | 2.92 | 0.0974 |
| 11:45 PM 12/5 | 2.92 | 0.0974 |
| 11:30 PM 12/5 | 2.92 | 0.0974 |
| 11:15 PM 12/5 | 2.93 | 0.0991 |
| 11:00 PM 12/5 | 2.92 | 0.0974 |
| 10:45 PM 12/5 | 2.92 | 0.0974 |
| 10:30 PM 12/5 | 2.93 | 0.0991 |
| 10:15 PM 12/5 | 2.94 | 0.101 |
| 10:00 PM 12/5 | 2.96 | 0.105 |
| 9:45 PM 12/5 | 2.97 | 0.106 |
| 9:30 PM 12/5 | 2.98 | 0.108 |
| 9:15 PM 12/5 | 2.99 | 0.11 |
| 9:00 PM 12/5 | 3 | 0.112 |
24' -
Look for flood depths up 2 feet at the edge of Harrah. Very severe flooding affects agricultural areas in eastern Oklahoma County... the southwest corner of Lincoln County... and northwestern Pottawatomie County.
23' -
Look for flood depths up 1 foot at the edge of Harrah. Very severe flooding affects agricultural areas in eastern Oklahoma County... the southwest corner of Lincoln County... and northwestern Pottawatomie County.
22' -
Look for minor depths of flooding at the edge of Harrah. Very severe flooding affects agricultural areas in eastern Oklahoma County... the southwest corner of Lincoln County... and northwestern Pottawatomie County.
21' -
Very severe flooding affects agricultural areas in eastern Oklahoma County... the southwest corner of Lincoln County... and northwestern Pottawatomie County.
20' -
Very severe flooding affects agricultural areas in eastern Oklahoma County... the southwest corner of Lincoln County... and northwestern Pottawatomie County.
19' -
Significant flooding affects agricultural areas and rural roads in eastern Oklahoma County... the southwest corner of Lincoln County... and northwestern Pottawatomie County.
18' -
Significant flooding affects agricultural areas and rural roads in eastern Oklahoma County... the southwest corner of Lincoln County... and northwestern Pottawatomie County.
17' -
Significant flooding affects agricultural areas and rural roads in eastern Oklahoma County... the southwest corner of Lincoln County... and northwestern Pottawatomie County.
16' -
Flooding affects agricultural areas and rural roads in eastern Oklahoma County... the southwest corner of Lincoln County... and northwestern Pottawatomie County.
15' -
Look for short duration flooding of low-lying agricultural lands and rural roads in eastern Oklahoma County... the southwest corner of lincoln... and northwestern Pottawatomie County.
14' -
Look for short duration flooding of low-lying agricultural lands in eastern Oklahoma County... the southwest corner of Lincoln County... and northwestern Pottawatomie County.
13' -
Near bankfull stages occur along the river in eastern Oklahoma County... the southwest corner of Lincoln County... and northwestern Pottawatomie County.
12' -
Shallow flooding of low-lying areas along the river occurs in eastern Oklahoma County... the southwest corner of Lincoln County... and northwestern Pottawatomie County.
11' -
Shallow flooding of low-lying areas along the river may occur in eastern Oklahoma County... the southwest corner of Lincoln County... and northwestern Pottawatomie County.
| Date | Stage (ft) |
|---|---|
| May 9, 1993 | 21.9 |
| Jun 1, 2013 | 21.02 |
| May 29, 1987 | 19.6 |
| Jun 10, 1995 | 19.3 |
| Aug 23, 2007 | 19.2 |
| Jun 14, 1989 | 19.07 |
| Jun 15, 2010 | 18.94 |
| Oct 21, 1983 | 18.94 |
| May 21, 2019 | 18.32 |
| Jun 30, 2007 | 18.15 |
| Jun 9, 1974 | 18.14 |
| Nov 5, 1974 | 17.93 |
| Aug 20, 2007 | 17.85 |
| May 7, 2015 | 17.3 |
| May 3, 1990 | 17.28 |
| Apr 25, 1999 | 17.02 |
| May 24, 2015 | 16.53 |
| May 23, 2019 | 16.36 |
| May 27, 1995 | 16.34 |
| Jul 13, 2007 | 16.19 |
Data provided by the National Weather Service.