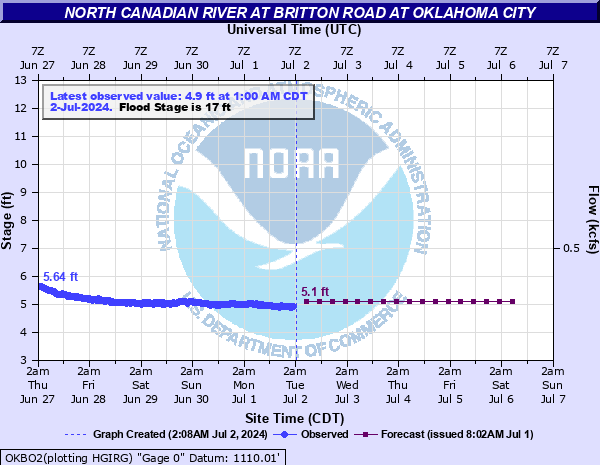
North Canadian River at Britton Road at Oklahoma City
Critical Stages
16' - Action
17' - Flood
21' - Moderate
26' - Major
Latest Observation
Updated: 4:00 AM CST 12/6/25
Status: No Flooding
Stage: 4.76 ft
Flow: 0.0285 kcfs
Forecast
| Time | Stage (ft) | Flow (kcfs) |
|---|---|---|
| 6 AM 12/6 | 4.8 | 0.0414 |
| 12 PM 12/6 | 4.9 | 0.0489 |
| 6 PM 12/6 | 4.9 | 0.0489 |
| 12 AM 12/7 | 4.9 | 0.0489 |
| 6 AM 12/7 | 5 | 0.0575 |
| 12 PM 12/7 | 4.9 | 0.0489 |
| 6 PM 12/7 | 5 | 0.0575 |
| 12 AM 12/8 | 5 | 0.0575 |
| 6 AM 12/8 | 5 | 0.0575 |
| 12 PM 12/8 | 5 | 0.0575 |
| 6 PM 12/8 | 5 | 0.0575 |
| 12 AM 12/9 | 5 | 0.0575 |
| 6 AM 12/9 | 5 | 0.0575 |
| 12 PM 12/9 | 5 | 0.0575 |
| 6 PM 12/9 | 5 | 0.0575 |
| 12 AM 12/10 | 5 | 0.0575 |
| 6 AM 12/10 | 5 | 0.0575 |
| Time | Stage (ft) | Flow (kcfs) |
|---|---|---|
| 4:00 AM 12/6 | 4.76 | 0.0285 |
| 3:30 AM 12/6 | 4.76 | 0.0285 |
| 3:00 AM 12/6 | 4.76 | 0.0285 |
| 2:30 AM 12/6 | 4.76 | 0.0285 |
| 2:00 AM 12/6 | 4.75 | 0.0241 |
| 1:30 AM 12/6 | 4.75 | 0.0241 |
| 1:00 AM 12/6 | 4.75 | 0.0241 |
| 12:30 AM 12/6 | 4.75 | 0.0241 |
| 12:00 AM 12/6 | 4.75 | 0.0241 |
| 11:30 PM 12/5 | 4.75 | 0.0241 |
| 11:00 PM 12/5 | 4.76 | 0.0285 |
| 10:30 PM 12/5 | 4.76 | 0.0285 |
| 10:00 PM 12/5 | 4.76 | 0.0285 |
| 9:30 PM 12/5 | 4.76 | 0.0285 |
| 9:00 PM 12/5 | 4.76 | 0.0285 |
| 8:30 PM 12/5 | 4.76 | 0.0285 |
| 8:00 PM 12/5 | 4.76 | 0.0285 |
| 7:30 PM 12/5 | 4.76 | 0.0285 |
| 7:00 PM 12/5 | 4.76 | 0.0285 |
| 6:30 PM 12/5 | 4.75 | 0.0241 |
| 6:00 PM 12/5 | 4.76 | 0.0285 |
| 5:30 PM 12/5 | 4.76 | 0.0285 |
| 5:00 PM 12/5 | 4.76 | 0.0285 |
| 4:30 PM 12/5 | 4.76 | 0.0285 |
| 4:00 PM 12/5 | 4.76 | 0.0285 |
| 3:30 PM 12/5 | 4.76 | 0.0285 |
| 3:00 PM 12/5 | 4.76 | 0.0285 |
| 2:30 PM 12/5 | 4.77 | 0.0338 |
| 2:00 PM 12/5 | 4.76 | 0.0285 |
| 1:30 PM 12/5 | 4.78 | 0.04 |
27' -
Numerous homes and businesses in Jones are damaged by major depths of flooding... or be surrounded by dangerous overflows to streets. Rural areas east of Oklahoma City near Spencer and downstream suffer severe damages to buildings... equipment... and roads.
26' -
Rural lands and roads east of Oklahoma City near the towns of Spencer and Jones are inundated by damaging depths with swift currents. The town of Spencer is not threatened by floodwaters from the river. Several homes and businesses in Jones sustain significant flooding or are surrounded by deep water in streets.
25' -
Rural lands and roads east of Oklahoma City near the towns of Spencer and Jones are inundated by damaging depths with swift currents. The town of Spencer is not threatened by floodwaters by the river. several homes and businesses in Jones sustain significant flooding or be surrounded by deep water in streets.
24' -
Croplands... pastures... and local roads east of Oklahoma City near the towns of Spencer and Jones are inundated by damaging overflows. Spencer is not threatened by floodwaters. Several homes and business in Jones may see flooding or be isolated by water in streets.
23' -
Croplands... pastures... and local roads east of Oklahoma City near the towns of Spencer and Jones are inundated by damaging overflows. Spencer is not threatened by floodwaters. Several homes and business in Jones may see flooding or be isolated by water in streets.
22' -
Croplands... pastures... and rural roads east of Oklahoma City near the towns of Spencer and Jones are inundated by significant overflow depths. Spencer is not affected by floodwaters... while shallow flooding may reach the outskirts of Jones.
21' -
Croplands... pastures... and rural roads east of Oklahoma City near the towns of Spencer and Jones are inundated by significant overflow depths. Spencer is not affected by floodwaters... while shallow flooding may reach outskirts of Jones.
20' -
Low-lying croplands and pastures east of Oklahoma City near the towns of Spencer and Jones are briefly flooded... and some local roads may overflow.
19' -
Low-lying croplands and pastures east of Oklahoma City near the towns of Spencer and Jones are briefly flooded... and some local roads may overflow.
18' -
Low-lying croplands and pastures east of Oklahoma City near the towns of Spencer and Jones are briefly flooded.
17' -
Low-lying croplands and pastures east of Oklahoma City near the towns of Spencer and Jones are briefly flooded.
16' -
Low-lying croplands and pastures east of Oklahoma City near the towns of Spencer and Jones may be briefly flooded.
| Date | Stage (ft) |
|---|---|
| May 9, 1993 | 24.8 |
| Jun 1, 2013 | 23.95 |
| Jun 13, 1989 | 23.48 |
| Jun 9, 1995 | 22.39 |
| Aug 22, 2007 | 22.38 |
| Jun 14, 2010 | 22.36 |
| Aug 19, 2007 | 22.09 |
| Jul 11, 1996 | 21.89 |
| May 8, 2007 | 21.5 |
| Sep 21, 1990 | 21.23 |
| Jun 29, 2007 | 20.95 |
| May 21, 2019 | 20.81 |
| May 1, 2000 | 20.64 |
| May 26, 1995 | 20.6 |
| Apr 25, 1999 | 20.47 |
| Mar 30, 2007 | 20.36 |
| Jun 15, 2010 | 20.02 |
| Oct 23, 2000 | 19.99 |
| May 24, 2015 | 19.6 |
| Jun 27, 2021 | 19.41 |
Data provided by the National Weather Service.